‘It looks like we’ve lost control’ of our ice sheets

Simply sign up to the Climate change myFT Digest -- delivered directly to your inbox.
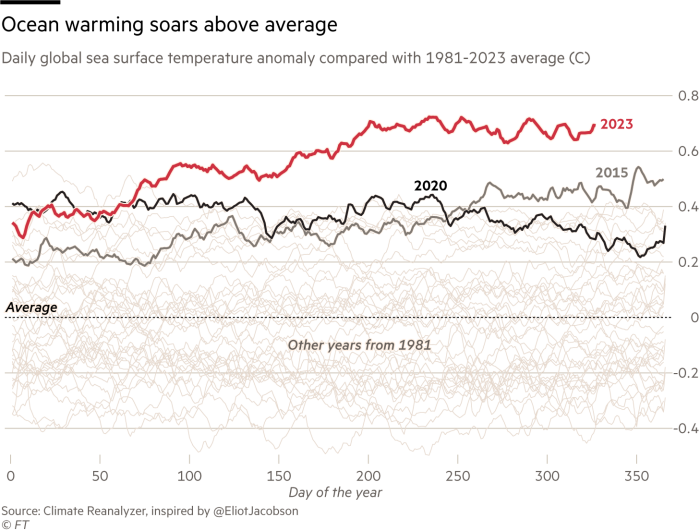
Oceans are warming at an accelerating rate, with average water temperatures increasing almost twice as fast between 2010 and 2020 as during the 1990s — and 2023 registering as the hottest year ever known in seas across the globe.
“Sea levels are rising because heat causes water to expand and ice to melt,” says Matthew England, professor at the University of New South Wales Centre for Marine Science and Innovation in Australia. “Ecosystems are also experiencing unprecedented heat stress; the frequency and intensity of extreme weather events are changing rapidly; and the costs are enormous.”
England is one of thousands of scientists diving into the physics, chemistry and biology of ocean warming, to gain a more detailed understanding of the processes involved — and decide how best to remediate their adverse effects.
About 90 per cent of the excess heat generated by human activity is absorbed by the oceans, so England’s team is working out the pattern of heat absorption around the globe.
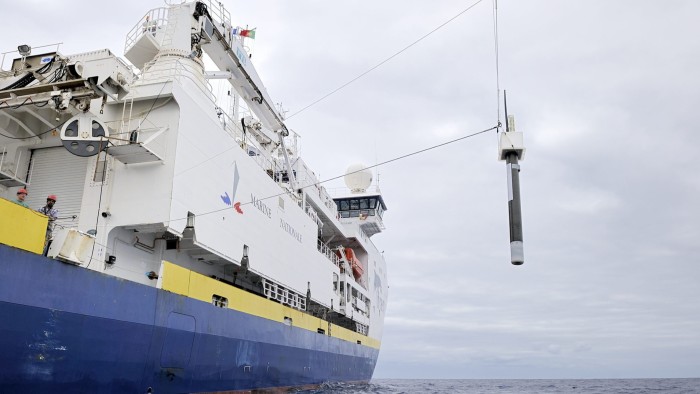
Data from thousands of floating robotic observatories maintained by the international Argo programme, combined with older measurements by ship-borne devices, show that the Southern Ocean around Antarctica is absorbing most heat — almost as much as the Pacific, Atlantic and Indian oceans combined.
The scientists, who published these findings in the journal Nature Communications, say the outlook for heat uptake in the next few decades has profound implications for regional and global climate change but remains uncertain. “It is critical we understand exactly how and where the ocean warms, both now and into the future,” says Sjoerd Groeskamp, an oceanographer at the Royal Netherlands Institute for Sea Research, and co-author of the study.
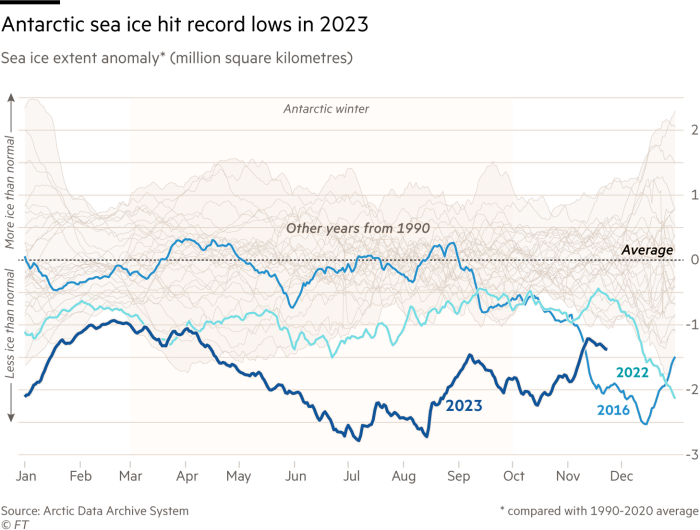
One of the most intensively researched consequences of ocean warming in the Southern Ocean is the melting of Antarctic ice. This ice takes three forms. Thinnest is the sea ice resulting from seasonal freezing; thickest is the ice sheet that coats the continent at an average depth of more than 2,000 metres; in between are the floating ice shelves, often hundreds of metres thick, which extend from the landmass into the ocean.

Supercomputer simulations by the British Antarctic Survey (BAS), published in the journal Nature Climate Change, show that accelerated melting of the West Antarctic Ice Sheet, driven by warming of the Southern Ocean, is unavoidable for the rest of this century — even in the most optimistic scenario of reducing greenhouse gas emissions. The ice sheet is the continent’s largest contributor to sea level rises, currently losing 80bn tonnes of ice per year, and it contains enough ice to raise global sea levels by five metres. The researchers do not predict how much will actually melt, because their model does not simulate all factors, such as snowfall on the ice sheet. But BAS ice specialist Kaitlin Naughten gives a depressing message.
“It looks like we’ve lost control of melting of the West Antarctic Ice Sheet,” she says. “If we wanted to preserve it in its historical state, we would have needed action on climate change decades ago. The bright side is that, by recognising this situation in advance, the world will have more time to adapt to the sea level rise that’s coming. If you need to abandon or substantially re-engineer a coastal region, having 50 years’ lead time is going to make all the difference.”
Another study, of 100,000 satellite radar images, led by the University of Leeds in the UK and published in the journal Science Advances, found almost all ice shelves on the western side of Antarctica had lost volume between 1997 and 2021, releasing a net 7.5tn tonnes of meltwater into the ocean. In contrast, most ice shelves on the eastern side remained steady or grew in volume.

The reason is that ocean temperature and currents are different on each side of the continent. “The western half is exposed to warm water, which can rapidly erode the ice shelves from below, whereas much of East Antarctica is currently protected from nearby warm water by a band of cold water at the coast,” says study leader, Benjamin Davison. “We expected most ice shelves to go through cycles of rapid but shortlived shrinking, then to regrow slowly. Instead, we see almost half [in the west] are shrinking, with no sign of recovery.”
A team led by the French National Centre for Scientific Research (CNRS) carried out a similar analysis of satellite images at the opposite end of the world. The study, published in Nature Communications, found the ice shelves of northern Greenland — once considered stable — had lost a third of their volume since 1978. Three have collapsed completely since 2000 and the remaining five are thinning fast as the warming ocean melts them from the bottom. If the ice shelves are no longer in place to buttress the north Greenland ice sheet, “this could have dramatic consequences in terms of sea level rise”, the researchers say.
Data visualisation by Steven Bernard
This article is part of an FT special report on Managing Climate Change
Climate Capital

Where climate change meets business, markets and politics. Explore the FT’s coverage here.
Are you curious about the FT’s environmental sustainability commitments? Find out more about our science-based targets here

Comments