How education level is the biggest predictor of support for Geert Wilders
Roula Khalaf, Editor of the FT, selects her favourite stories in this weekly newsletter.
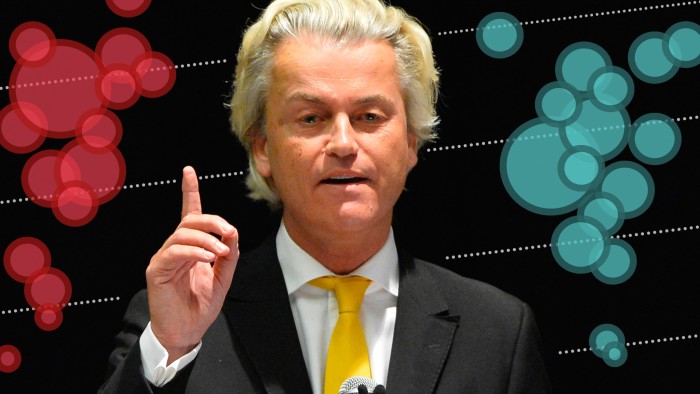
Education, rather than exposure to immigrants, is emerging as the clearest nationwide indicator of the likelihood of Dutch voters supporting Geert Wilders’ anti-immigration Party for Freedom, according to an extensive Financial Times survey of demographic and voting data from the most recent general election.
Mr Wilders’ Party for Freedom (PVV) looks on course to win the most seats in the upcoming election on March 15, but is likely to be blocked from power after most parties indicated that they would refuse to join it in a coalition.
The PVV’s resurgence is part of a wave of populism that has swept Europe, capitalising on fears over immigration, growing Euroscepticism and anti-establishment sentiment.
The blond-haired populist paints an idyllic picture of his supporters, labelling them Henk and Ingrid.
In Mr Wilders’ words, they are the “backbone” of Dutch society: “Mr and Mrs Average with their own houses, one nice holiday a year and an active social life.”
In the eyes of Frits Bolkestein, a former mentor turned critic of Mr Wilders, they are something else: “People with a grudge. They’re unemployed, their daughter’s on drugs and their son has run away.” The reality is more complicated.
The detailed analysis of 2012 data throws up a complex web of reasons for the rise in support for the PVV in the Netherlands but some patterns have emerged. It suggests a clear rural and urban divide in the way communities react to the presence of immigrants.
While the percentage of immigrants correlates with the PVV’s vote share in the countryside, this is not the case in the cities.
The PVV has a strong foothold in traditionally working-class cities such as Rotterdam, but struggles to gain traction in places such as Amsterdam. Both cities have large immigrant populations.
Stijn van Kessel, a politics lecturer at Loughborough University, says: “In some cities he does well, in others he does not.”
However, the level of education attainment straddles this town-and-country divide, so that the more qualified the population, the lower the level of support for Mr Wilders.
“The vote for the PVV of the low-educated is often framed as sheer stupidity. But this is nonsense. These people know where this party stands,” argues Gijs Schumacher, an expert in populism at the University of Amsterdam.
Those without qualifications are likely to feel the brunt of globalisation and immigration, issues that Mr Wilders has railed against since founding his party in 2004. “It is not irrational,” Mr Schumacher added.
This means that the most fertile territory for Mr Wilders, outside his home province of Limburg, are rural areas with higher numbers of immigrants and a lower proportion of more educated voters.
Education changes outlook, argues Mr van Kessel. “Highly educated people think that they benefit from globalisation, and are socially mobile: it provides them with opportunities rather than threats.” He adds: “Feelings of insecurity, whether justified or not, lead people to vote for the PVV.”
The data also throw up a striking contrast to both the UK’s Brexit referendum and last year’s US presidential election. In both those polls older voters showed a higher propensity to support the anti-establishment option.
In the Netherlands, however, over-65s have been the least likely age group to support Mr Wilders. Compared with other populist parties in Europe, such as the Front National in France, support for the PVV is relatively young, says Mr Schumacher.
“People often form their voting preferences in their early years,” he says. “If there is a new party on voter menus, then young people are more likely to consider it.”
The divide in attitudes between town and country also highlights a difference from the Brexit vote. In the UK, areas with very small immigrant communities were among the strongest supporters of a vote for the country to leave the EU.
Recent events in Europe could provide a fertile background for the PVV, argues Cas Mudde, a professor in international affairs at the University of Georgia, who has written a number of books on populism.
“We have been talking about refugees, terrorism and a failing EU, which is exactly what the radical right says. If that is the position, then the radical right has a good position,” he says.
One critical test for Mr Wilders will be whether he can capitalise on the refugee crisis to boost his vote in the cities that have proved largely indifferent to increases in the number of immigrants. But the data, which predate the crisis, suggest that this could be a challenge.
The project saw FT journalists examine the impact of more than 60 demographic and geographic factors, ranging from income levels and ethnicity to educational qualifications and population density, on the 2012 general election and earlier national votes.
The 60 variables were distilled to the most significant factors in an attempt to glean insights into the forces driving the PVV’s success. The FT will be running similar exercises for all the major elections in Europe this year and refining its models with the data from each one.
Education
The strongest relationship between the PVV’s vote share and any demographic indicator was with education: the higher the proportion of the population that left the academic system without a degree or higher vocational qualification, the bigger the vote for Mr Wilders.
Unlike the rest of the indicators, such as immigration, this correlation between the PVV’s success and low educational attainment held true across the country, in both rural and urban areas. It was stronger in towns and cities.
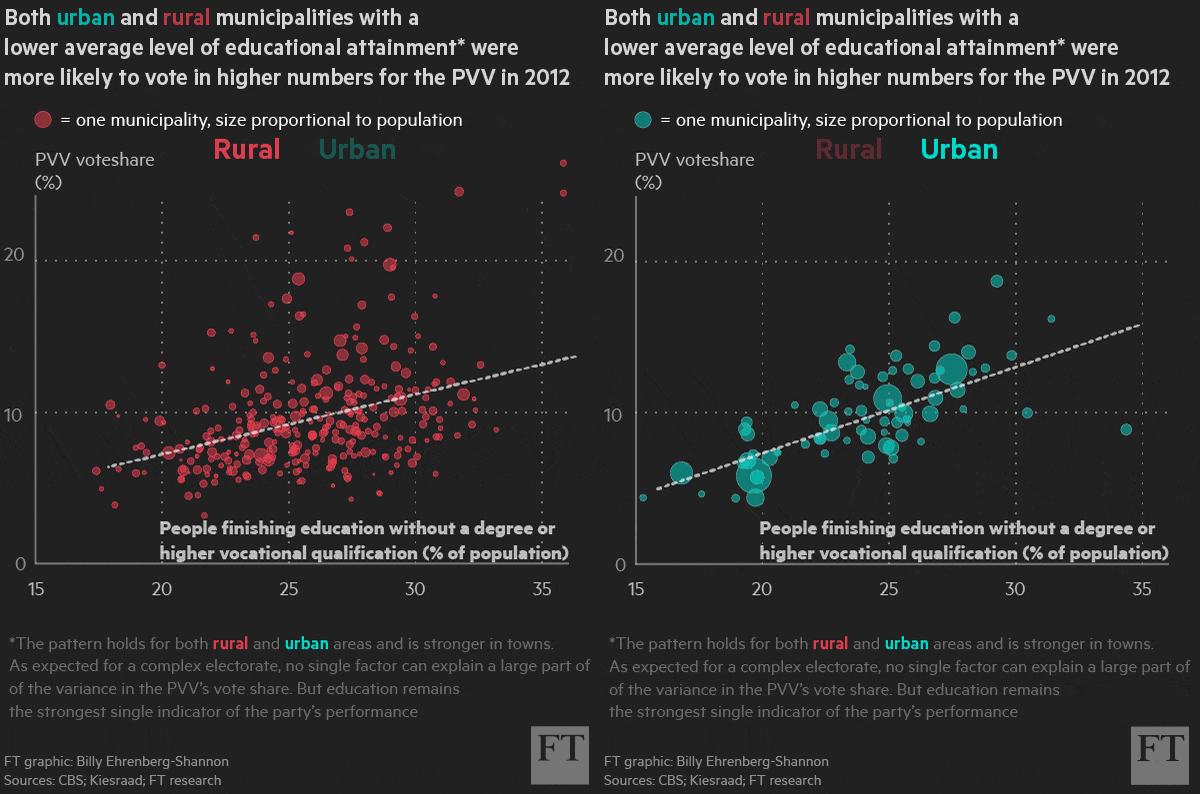
Reinforcing the trend is a relatively strong link between university graduates and the level of support for the PVV: the more people with degrees there are in an area, the lower the preference for Mr Wilders’ populist agenda.
The graphic above shows the influence of education in isolation but because of the complex nature of the electorate, education seems to explain only a part of the variance in the PVV vote. In order to explore its full importance, we controlled for other important demographic elements.
Even when age, employment conditions, the rural-urban split, immigration and geography were taken into account, a low level of education remained a strong indicator of PVV success across the Netherlands.
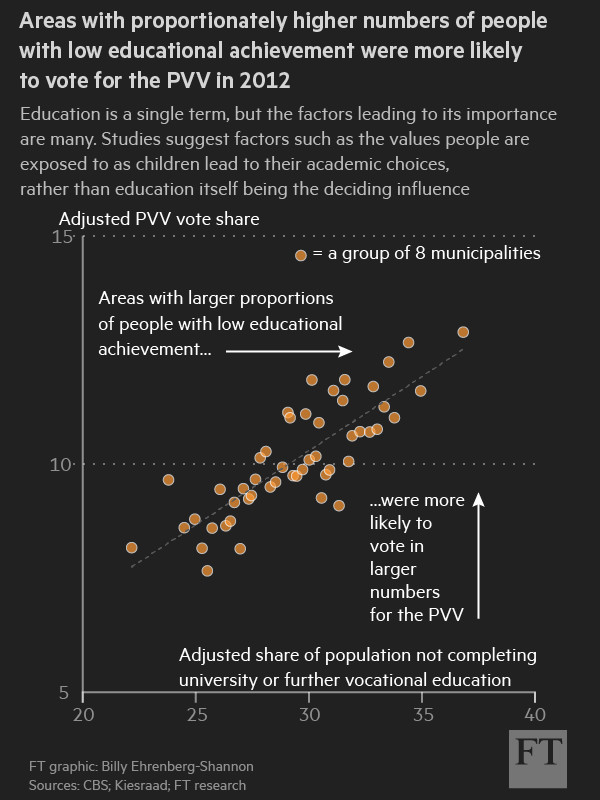
Why these relationships exist is not easy to explain. Dismissing PVV supporters as undereducated (similar sentiment was expressed towards Leave voters in the UK’s EU referendum and Donald Trump supporters in the US elections) would be simplistic.
Education’s apparent influence on voting patterns is not simply that better-educated people understand the debate, or that exposure to a more diverse mix of people at university increases tolerance of social difference.
Rather, educational achievement could be a result of social and personality-based factors that lead a pupil to self-select their academic route, as a previous Financial Times analysis explored.
Immigration
Although the data support the widespread assumption that immigration has been a central issue in recent elections involving populist contenders, analysis has shown that it works in different ways.
Analysis of the Brexit vote suggested that a change in the number of immigrants was more important than the total number in an area, while the opposite was true of the US presidential contest.
The 2012 Dutch data suggest that the effect of immigration on voting behaviour is akin to the US model. The number of immigrants in an area seems to influence the PVV vote much more in the countryside, despite the fact immigrants there are proportionately fewer.
By contrast, in urban areas where immigration is higher, the data show the total number of immigrants has no notable effect on voting patterns.
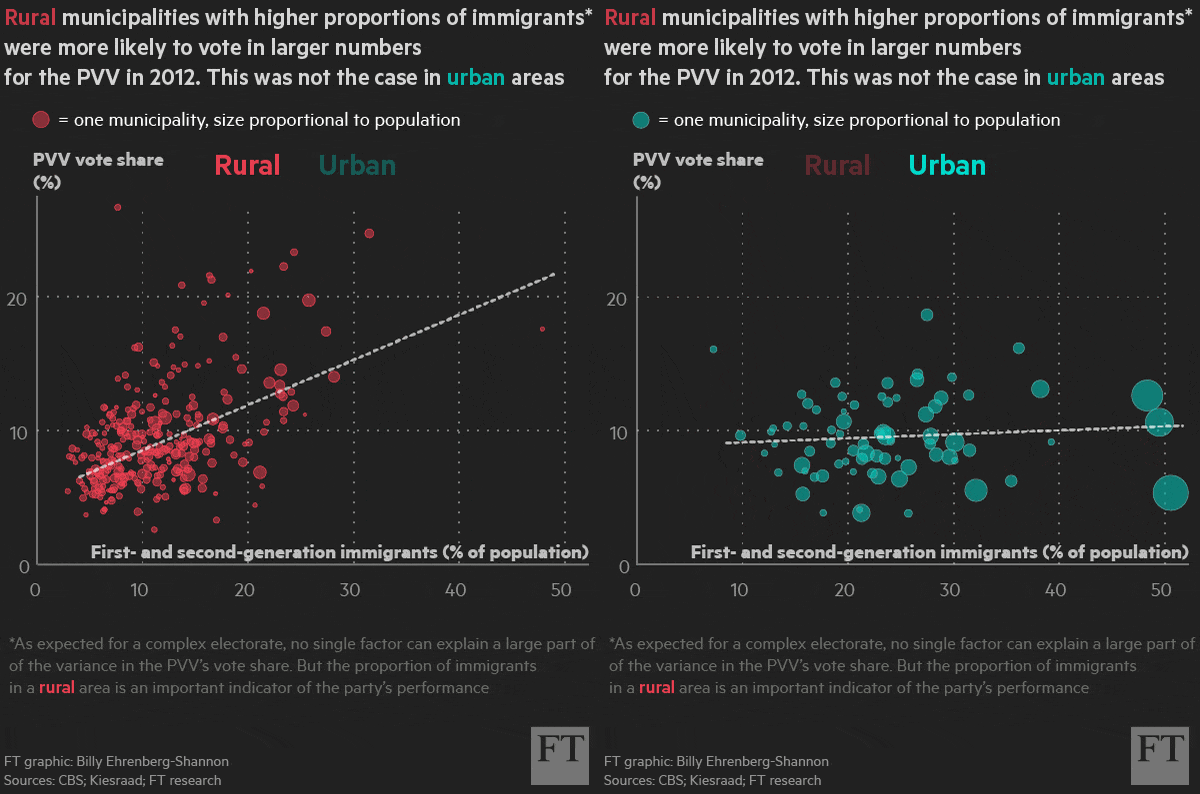
In both rural and urban areas, the effects of the immigration rate — the gross number of immigrants arriving in a given year — was minimal in 2012. This is perhaps unsurprising, given the Netherlands has a relatively low immigration rate.
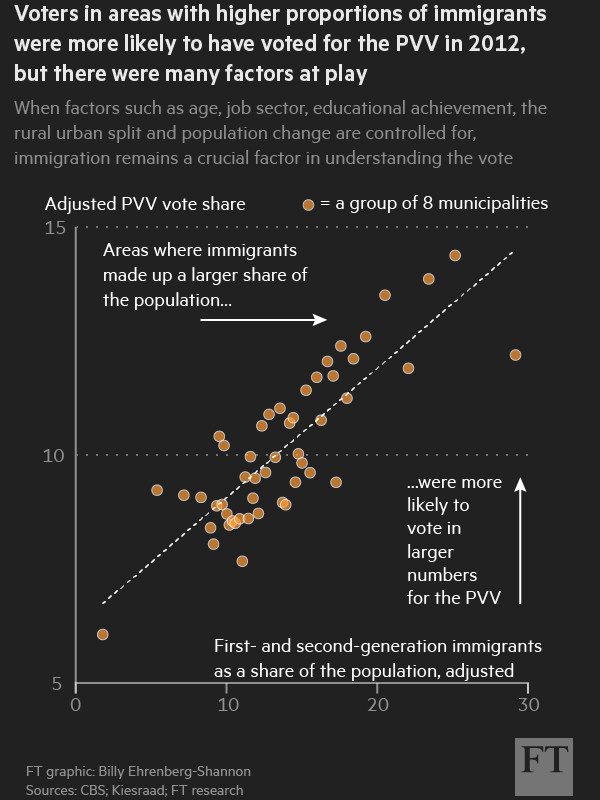
Understanding the influence of immigration can be difficult, as areas with high proportions of immigrants are often affected by a variety of social conditions, which may themselves have influenced the PVV’s vote share.
In order to isolate the effect that immigration had, our analysis adjusted for factors such as age, educational achievement, population, job sector and different employment conditions — and still found immigration to be significant, as the chart below shows.
Age
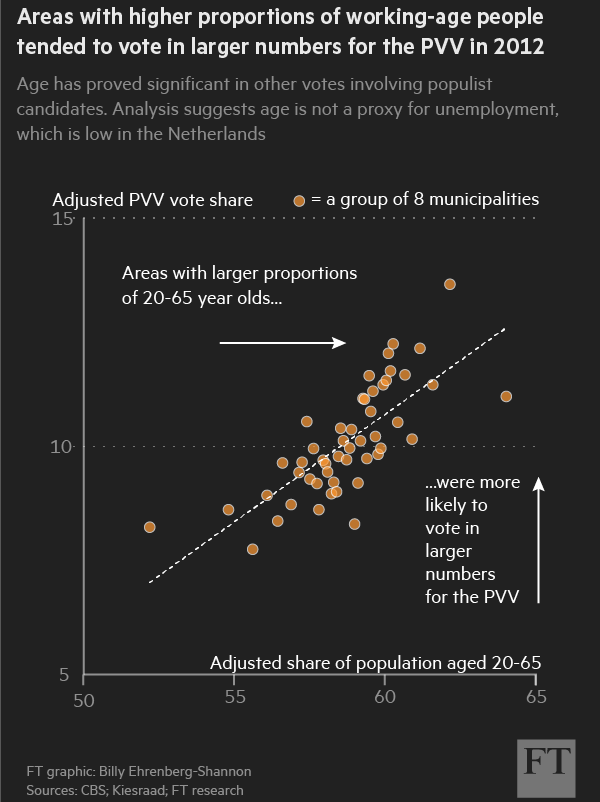
Age has been a reliable predictor of voters’ behaviour in other plebiscites featuring populist candidates.
In both the US presidential election and the UK’s EU referendum, older voters came out in support of the populist contenders. The Netherlands appears to be bucking the trend. Mr Wilders is harnessing the support of voters of working-age (important to note, unemployment does not seem to play a role), but mainly those in rural areas.
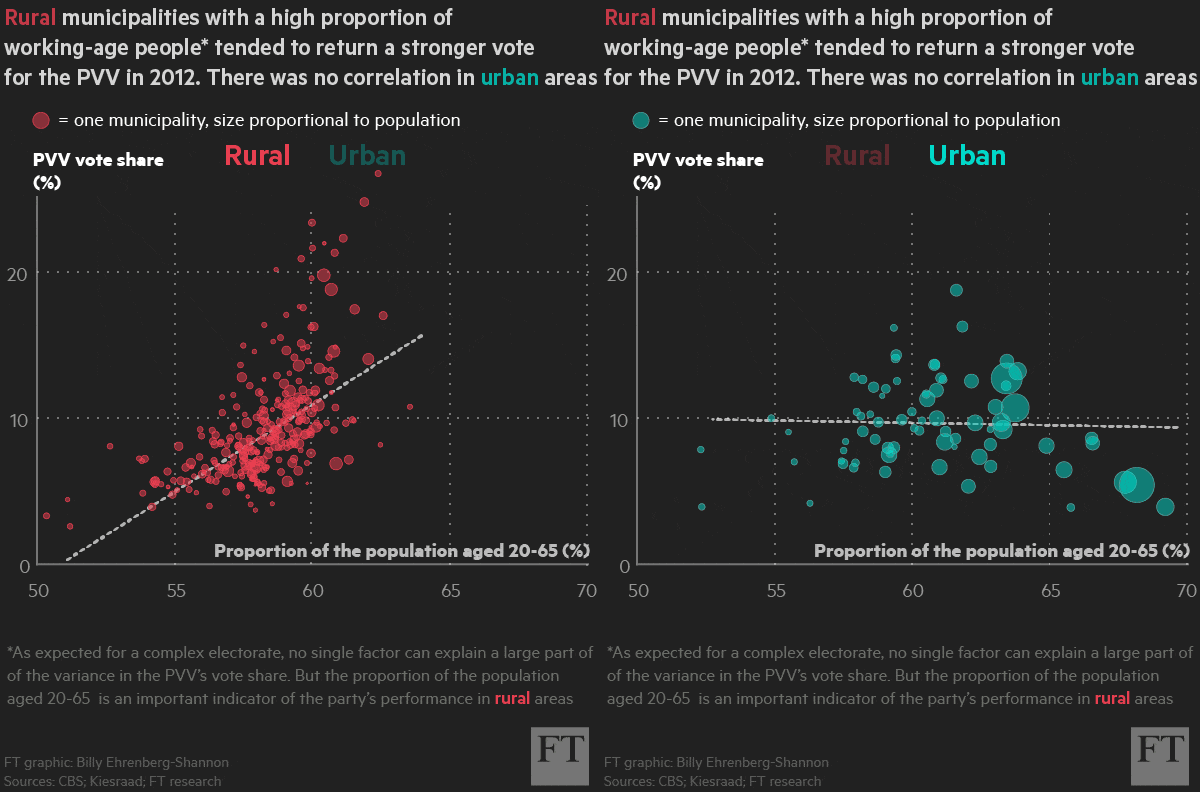
Areas with larger proportions of over-65s are less likely to have supported Mr Wilders, despite the PVV wooing retirees with promises to reverse changes to the pension age.
Once again, we adjusted for the most important variables — educational achievement, immigration, population, job sector and different employment conditions — and found age to be significant. It did not, however, correlate as strongly as immigration or education.
Other factors
Our best model for understanding the 2012 vote includes other secondary demographic data, which may not appear important in isolation, but become significant when examined alongside other factors.
In order to determine the most important demographic characteristics, the FT’s analysis checked the effects of more than 60 demographic and geographical characteristics.
Our extensive analysis led to a hypothesis that a mixture of immigration, education, public sector jobs, the rural-urban divide, geography and the working-age population best account for the PVV’s vote across the country.
The model had to adjust for two important factors that emerged from the analysis: the rural-urban divide explored above in the context of immigration and age, and the effect of Mr Wilders’ home province of Limburg, which is tackled next.
The Limburg question
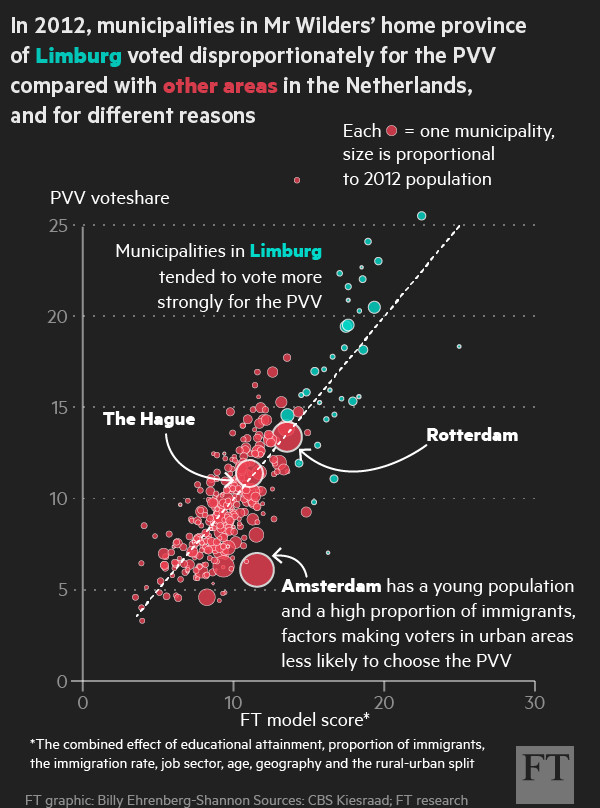
As with the Brexit vote, there was an important geographical factor at play in 2012. Like Scotland in the EU referendum, the southern province of Limburg appeared to be affected by different forces than in the rest of the Netherlands.
The majority of Mr Wilders’ best results came from municipalities in Limburg, the province in which he was born.
The larger vote share for the PVV in the region correlated with factors such as lower wages and declining population, characteristics that proved insignificant in the rest of the country.
Limburg’s apparent attachment to Mr Wilders means that its peculiar demographics run the risk of being exaggerated in any analysis. Its unique position is clearly visible on the chart below.
This analysis has offered an exclusive insight into the mechanics of populism in the Netherlands.
It remains to be seen to what extent the influences of 2012 remain relevant in 2017. The Greek debt issue, Europe’s refugee crisis and the populist successes in the US and UK mean that the March election will be held in a very different political climate.
…
How we analysed the data
For its exclusive analysis, the FT analysed demographic and election results data for 418 municipalities in the Netherlands, based on the 2012 general election. The investigation revealed a complex electoral landscape, where many factors worked together to drive the PVV vote.
The regression model charted above represents our best guess, where we are able to hypothesise on about 67 per cent of the variance in the vote for Mr Wilders’ party.
Our analysis started by exploring the effects of more than 60 variables, before distilling them to the three most important. We then began to build a model, exploring how variables become more significant when others are introduced, or when they interact with one another.
It was important to examine Limburg and the rest of the country separately, and to explore urban and rural areas in isolation, before combining the various hypotheses to form our final model.
This led to a model that explored the effects of education, the immigration rate, the proportion of immigrants in an area, the rural-urban divide, income, age and job sector.
Additional reporting by Duncan Robinson
Data project concept by John Burn-Murdoch ; Additional data reporting by Gavin Jackson

Comments