What just happened?


Roula Khalaf, Editor of the FT, selects her favourite stories in this weekly newsletter.
This article is an on-site version of our Unhedged newsletter. Sign up here to get the newsletter sent straight to your inbox every weekday
Good morning. On Wednesday, stocks and bonds rose merrily after the Fed chair said that 75 basis point rate increases were not under active discussion by the Open Market Committee. This struck us as weird, given that chair Jay Powell was at pains to emphasise his focus on inflation and his willingness to be more aggressive if needed. He just didn’t sound dovish to us. Thursday, both stocks and bonds fell hard, more than reversing the prior day’s moves. For a moment we felt vindicated. Closer examination of the facts left us puzzled once again. Below, we try to make sense of the gyrations, to the degree possible. Email us: robert.armstrong@ft.com and ethan.wu@ft.com.
We’re taking Monday off. While we’re away, read the FT’s Asset Management newsletter, which comes out on Mondays.
Very bad day follows very good day
Here’s a thumbnail sketch of what happened Thursday:
The S&P 500 fell 3.5 per cent
The Nasdaq fell 5 per cent
Long-dated Treasury yields rose — the 10-year by 14 basis points, to hit 3.06 per cent
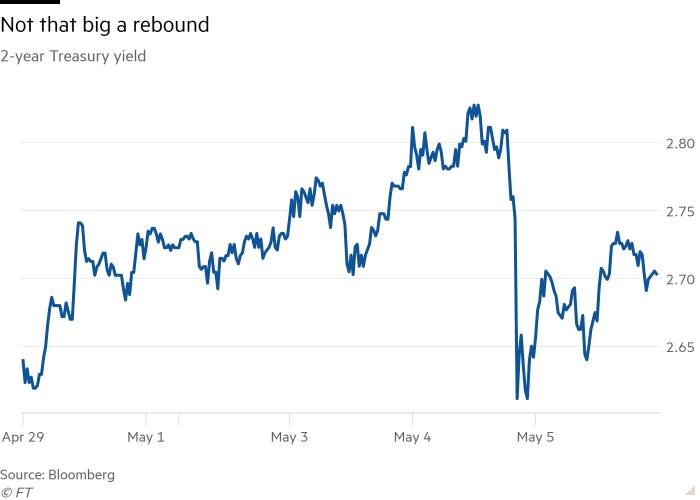
Short-dated treasuries rose, but by less — the 2-year rose 8 basis points, to 2.71 per cent
Inflation-protected Treasury yields rose — the 10-year by 13 basis points, to hit 0.184 per cent
Commodities were stable to up — oil, gold and copper all rose slightly
The Vix volatility index hit 31 — high, but no higher than the peaks of recent weeks. Indeed it hit 36 on Monday.
All of these moves, except for commodities, were meaty. This was a big across-the-board sell-off. Bonds provided no shelter from the carnage in stocks.
What happened? Is there a coherent and compelling narrative here? There doesn’t have to be. When the trend is downward, volatility is up, and liquidity is patchy, markets reflect portfolio decisions made under duress more than they reflect stable economic realities. Still, amid the wreckage, the market might be telling us something useful.
A few broad possibilities:
Market participants realised Wednesday, en masse, that the Fed was much more hawkish than they had concluded initially. So short rates must rise, and with them, the possibility of a recession. Stocks do not like recessions.
Market participants realised Wednesday, en masse, that the Fed was even more dovish than they concluded initially, so inflation was more likely to be higher for longer. So long rates must rise, commodities look more attractive. Stocks do not like runaway inflation, either.
It’s not all about the Fed. Maybe investors are simply realising that the outlooks for the economy, corporate earnings and speculative appetite are not very good.
Possibility #1 makes sense inasmuch as short rates fell hard as Powell spoke Wednesday, and then rose Thursday. And stocks got killed, which fits. But short rates didn’t rise that much, and long yields rose even more, an odd response to a recession.

If the idea here is that, inspired by the ghost of Paul Volcker, Powell is going to push us into a recession, the yield curve should be flattening. But it’s steepening.
Possibility #2 makes sense in that the difference between nominal and inflation-protected yields widened, increasing so-called “inflation break-evens”. Also the relative strength of commodities amid the chaos makes sense if more inflation is coming. Higher long rates fit higher inflation as well. But 10-year break-evens rose only a little, and only did that because nominal yields rose like mad. Five-year break-evens actually fell a smidgen. If inflation panic were worsening, I’d expect inflation-protected yields to fall, or at least not rise as much as they did Wednesday. Further, the two-year closely tracks expectations for the fed funds rate. Why did it rise if we’ve all decided Powell is a terrible wimp?
If the pieces don’t quite fit for #1 and #2, we can turn happily to #3, which is flexible and all-purpose. Let us briefly recall the five most salient features of this investing environment:
Strong consumer and corporate balance sheets
Inflation, which is driven in some significant part by supply shocks from Covid and war, which central bank monetary tools cannot solve
Slowing economic growth, as seen in everything from global PMIs to falling trucking rates
Central banks that are tightening despite the supply issues and slowing growth — as personified Wednesday by the Bank of England, which yesterday both warned of recession and increased interest rates
Very high stock valuations
Only the first item is supportive of risk assets. The others are negative, and compound one another. Very bad days just happen when the backdrop is this poor.
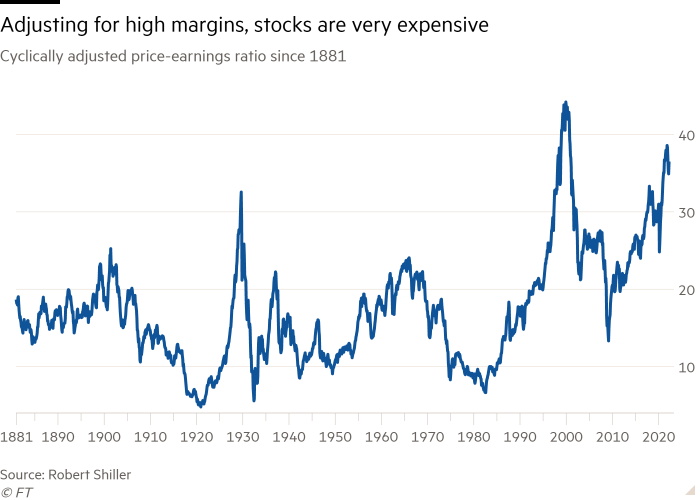
The last point on that list is likely becoming more important. We have not spoken very much about high valuations at Unhedged, because for many years most valuation measures have been sending bad signals. Stocks have looked expensive on traditional metrics for much of the last decade, but they have continued to rise. Referring to, say, Robert Shiller’s cyclically adjusted P/E ratio has been liable to get a person made fun of online. But now that the momentum is downward, and we are wondering how low stocks can go rather than how high they can reach, it may be time to think about valuations again. Here is Shiller’s ratio, which divides the price of the S&P 500 by 10-year average earnings:

There has been a fair amount of talk from brokers recently about how recent price declines have made valuations more attractive. But this ignores cyclicality. Specifically, it ignores the fact (which we recently discussed here) that Covid-era margins have been extraordinarily high and seem likely to come down. Adjust for this, as the Shiller ratio does, and stock prices still look very high. This doesn’t tell you that they have to come down, but it removes a key psychological support in a stressful time.
We are left with a final puzzle. After a stomach-churning few days, why isn’t the Vix higher? Garrett DeSimone, head of research at OptionMetrics, likes to say the Vix can be seen as the cost of insuring a stock portfolio against declines. If things are so bad, why isn’t the price of insurance rising more? DeSimone thinks it suggests that things might calm down in the coming days. But there is another possibility: that people don’t want insurance. They’d rather just sell.
One good read
American nationalists have a thing about cat ladies. This makes perfect sense.
Comments