Meet Morgan Stanley's chief cartoonist
Simply sign up to the US & Canadian companies myFT Digest -- delivered directly to your inbox.
There are many ways to stand out from the throng of young hungry graduates applying for prized investment banking jobs every year, but few do so with witty penmanship.
In 2004 Gregory Peters was interviewing candidates for a slot on Morgan Stanley’s credit strategy team, and one young Brown University graduate caught his eye. It wasn’t his degree in mathematics and economics – or even his stint on Brown’s ultimate Frisbee team – but a stint drawing cartoons for the university paper.
“I thought it was perfect,” recalls Mr Peters, who is now a senior fund manager at PGIM Fixed Income. “He could take the most complex things going on in markets and turn them into these brilliant little cartoons.”
Andrew Sheets, the young graduate he hired over a decade ago, is now head of cross-asset strategy at Morgan Stanley, after a decade of covering corporate bond markets in the US and Europe. But the cartoons have continued to flow, and together form a light-hearted, vivid history of a turbulent period for markets and the global economy.
Mr Sheets first discovered cartoons in his hometown newspaper in Portland, The Oregonian, but his break came when several aspiring cartoonists suddenly quit the Brown Daily Herald student newspaper – which opened up an opportunity he seized. It was a steep learning curve.
“It’s an ongoing challenge drawing even simple things,” he says. “The human eye is actually very good at picking up even tiny things that are out of whack, like a too short forearm or an odd smile. So there is a lot of erasing involved.”
Finance might seem an ill fit for cartooning, given how esoteric and tricky to visualise the subject matter can be. Charts may be a mainstay component of analyst research reports, but they hardly make good fodder for a more graphic representation of what is going on.
But Mr Sheets reckons that the effort to boil down a nuanced argument on a complex subject into a single punchy cartoon is a good exercise for analysts. “The format forces you to step back and not lose sight of the bigger picture,” he says. “There are a lot of ideas that get crumpled up and thrown away because I feel I’m trying to force it.”
The first one. September 8, 2004.
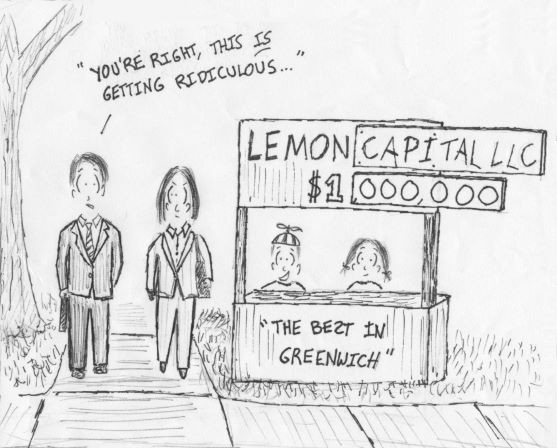
This was the very first cartoon Mr Sheets drew for Morgan Stanley, making fun of the hedge fund boom (many of which were based in Greenwich, Connecticut).
The CDO bid. September 17, 2004.
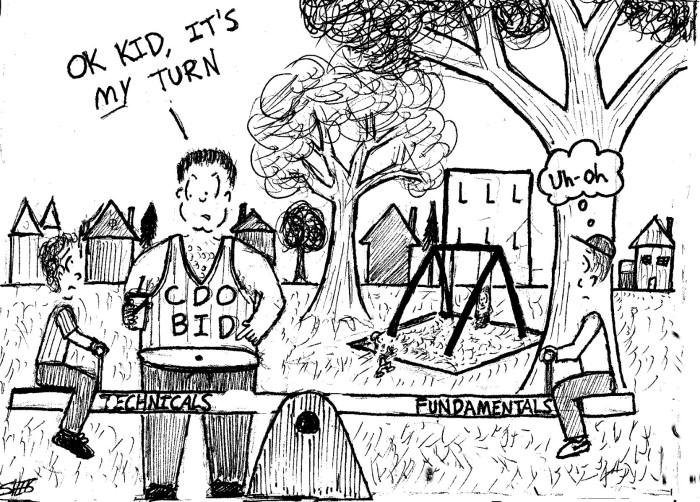
The first that tackled the booming structured finance industry, highlighting how ravenous demand from collateralised debt obligations was overpowering the debt market’s fundamentals.
The EPS bunny. February 11, 2005.
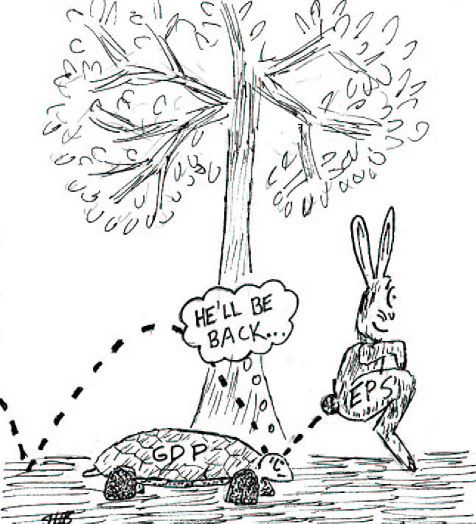
This cartoon highlighted how corporate earnings were bounding ahead of the US economy’s growth, and predicted a reversal. It took three years though.
Credit police. March 11, 2005.
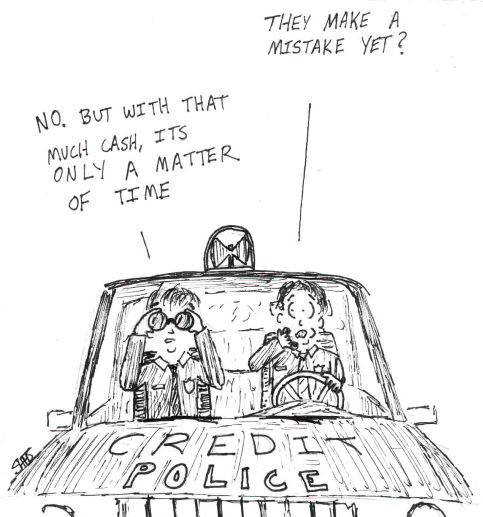
Back in 2005 many US companies were still hoarding cash, but Morgan Stanley worried that these cash piles were becoming tempting targets for activists, private equity – or the company’s own management.
Tax doping. April 22, 2005.
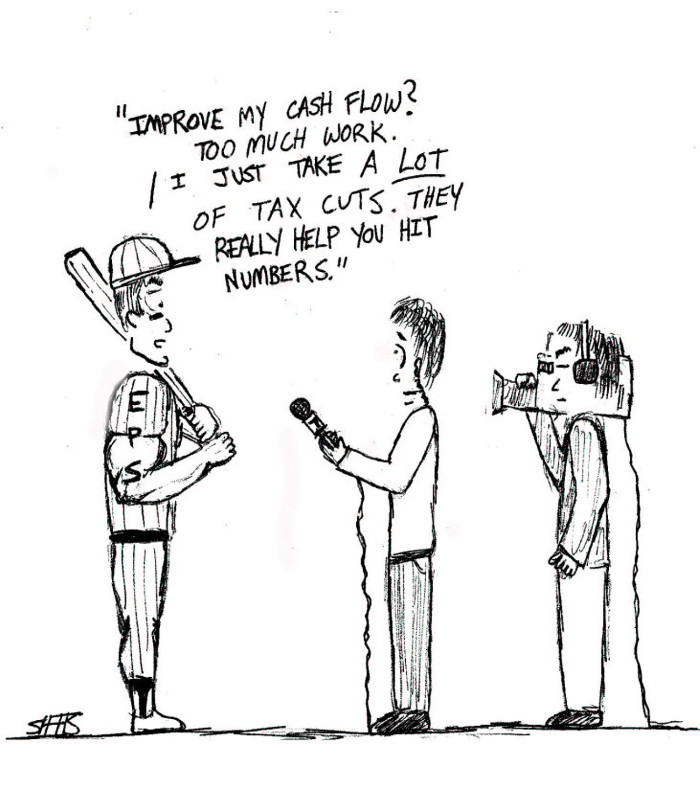
Many of Morgan Stanley’s noughties cartoons could run today with only a few minor tweaks, but this one from 2005 – mocking how tax cuts can juice corporate earnings - could run unaltered.
Demand begets demand. March 24, 2006.
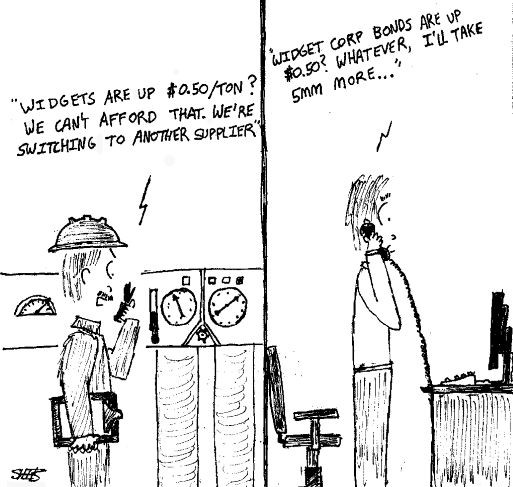
This cartoon illustrates one of the oddities of investing. Normally, orthodox economics dictates that rising prices should lead to less demand, but in finance it can work differently.
The coupon baby. March 31, 2006.
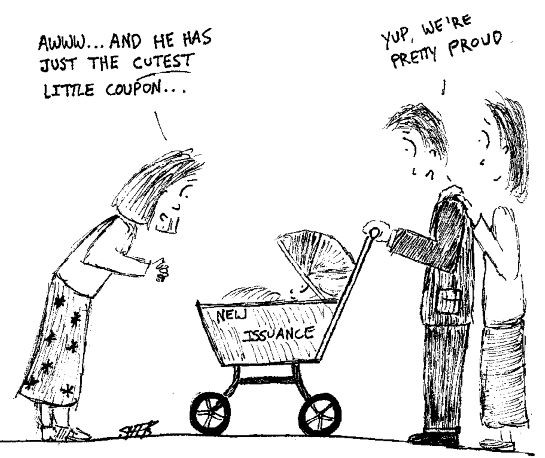
By 2006 credit markets were so frothy that companies were able to issue debt with ever-lower interest payments, or coupons.
Shorting Treasuries. July 14, 2006.
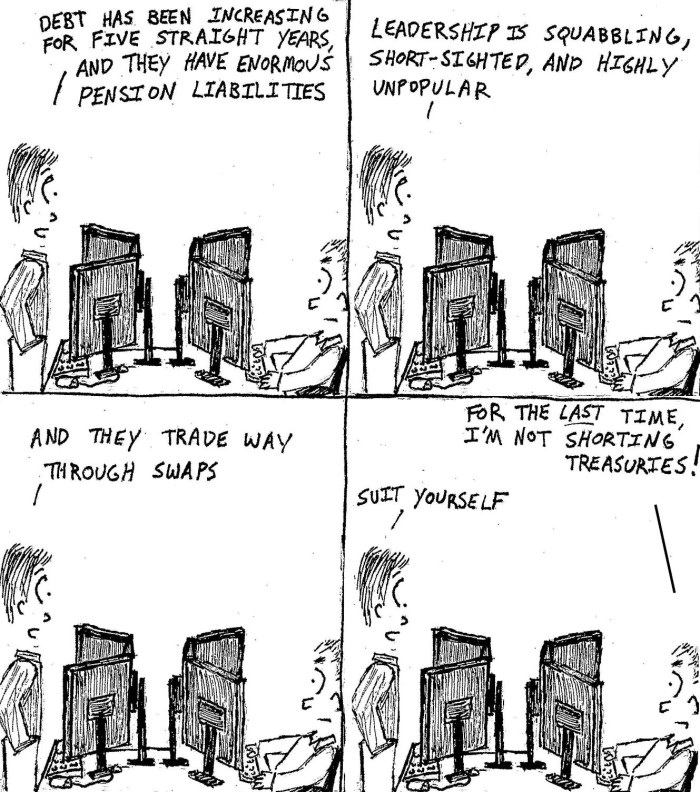
This one should be pinned on the desk of many hedge fund managers. The temptation to short US government debt is understandable, but the market has remained resilient despite several interest rate hiking cycles over the past three decades.
The housing bubble. August 11, 2006.
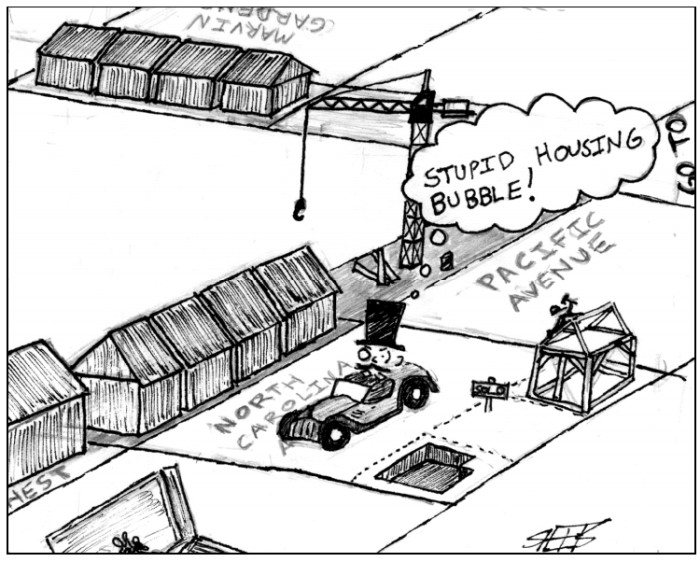
The US housing market was on a tear in the noughties, with almost every region booming. But prices began to decline in August 2006, and would eventually trigger the financial crisis.
Structured finance frenzy. December 13, 2006.
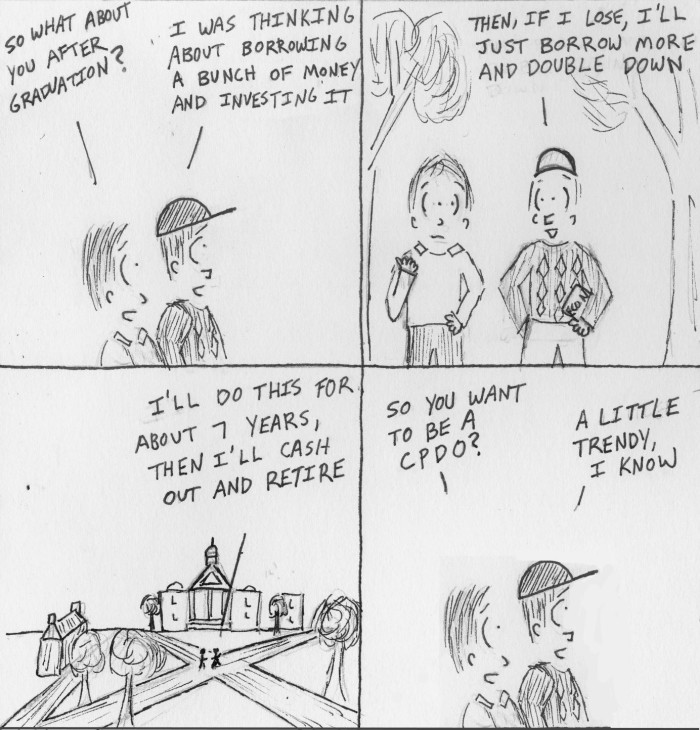
Tighter spreads in corporate debt encouraged financial engineers to churn out more complex, leveraged structures to try to squeeze out higher returns, which boasted an alphabet soup of acronyms like the CPDO (a constant proportion debt obligation).
The Escher staircase of markets. December 13, 2006.

Another cartoon that has a distinctly modern feel to it.
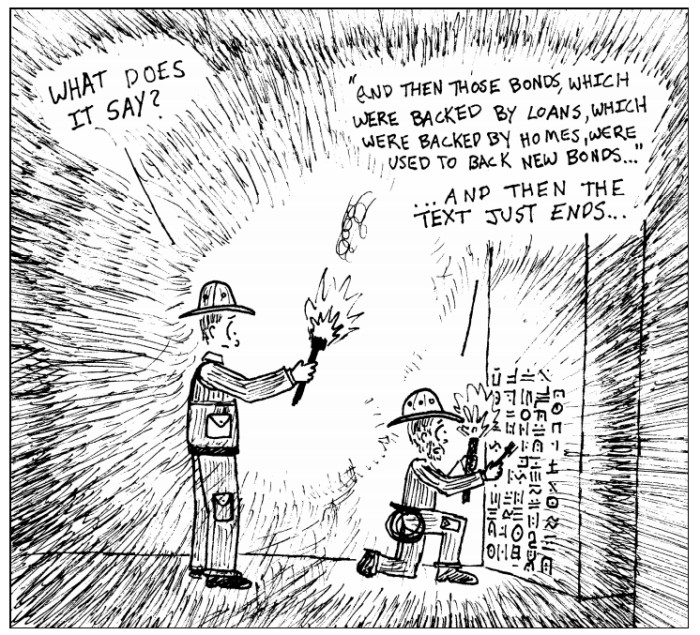
Spreading subprime woes. March 30, 2007.

The wider world – and the Federal Reserve - might not have realised the dangers that the spreading subprime mortgage debacle posed to the financial system, but some credit analysts were beginning to get worried. A few days after this cartoon ran, New Century Financial, a big subprime lender, went bankrupt.
Subprime starts to go primetime. September 2, 2007.
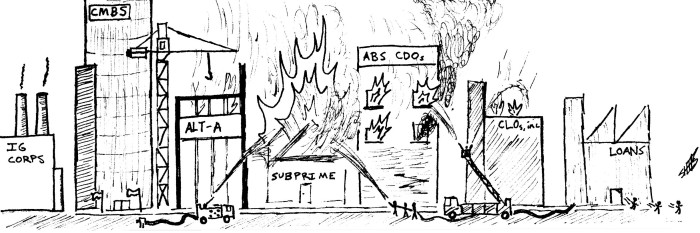
By the summer of 2007, more people were waking up to the problems in credit markets. In July Bear Stearns liquidated two hedge funds that invested in mortgage-backed securities, in August BNP Paribas halted withdrawals on three of its funds, and by September the flames were spreading.
Combat pay. September 6, 2007.

It was a tough time for bond traders that had gotten used to easier market conditions.
Bond raiders. December 14, 2007.
Most people were still blissfully unaware over the spreading subprime meltdown, but credit analysts like Mr Sheets were getting increasingly worried.
Senatorial inquisition. May 6, 2008.
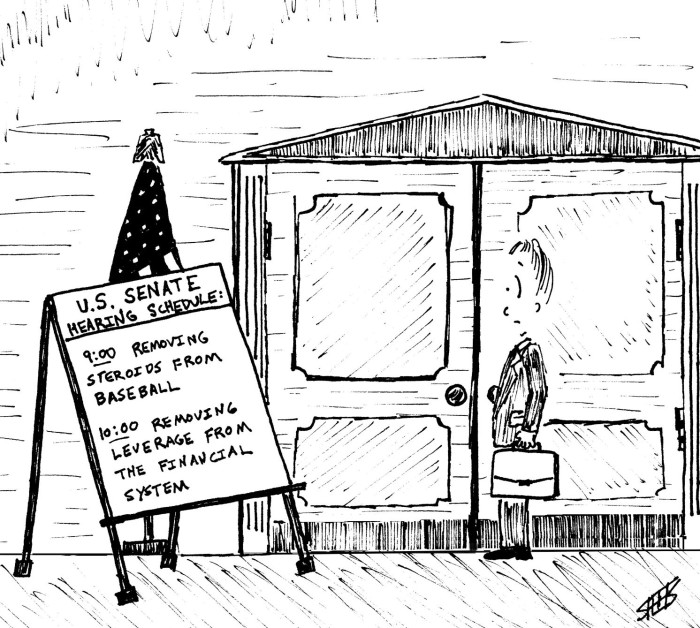
After Bear Stearns collapsed in March 2008, leading to a government-engineered shotgun marriage with JPMorgan, even politicians began to take note of the credit crisis.
Stagflation fears. June 13, 2008.
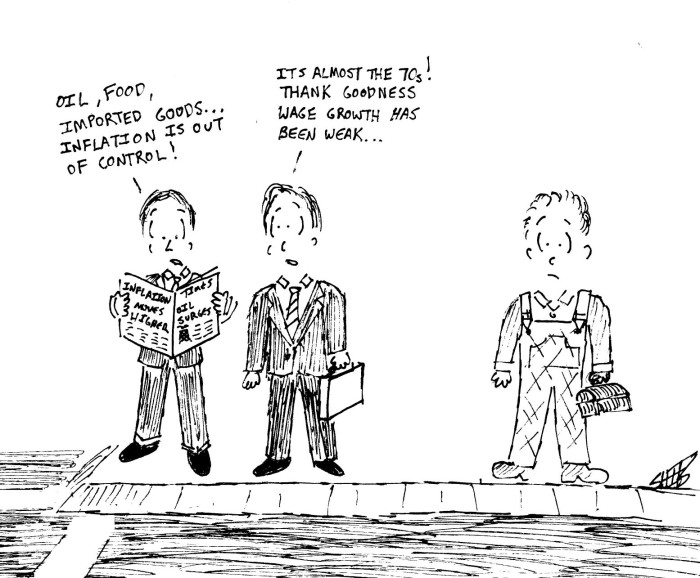
One of the oft-forgotten contributors to the US recession was oil prices soaring to a record high ahead of Lehman’s collapse, which stoked fears of ‘stagflation’. By the end of the year, deflation was the biggest worry.
Battle stations. September 18, 2008.
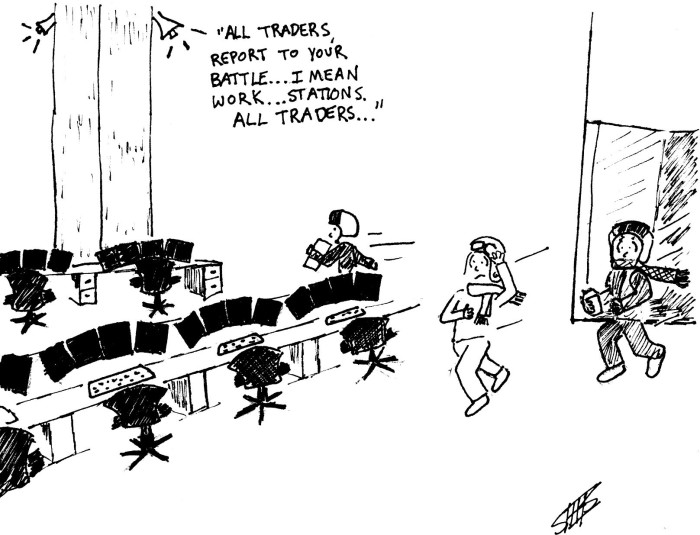
Traders might have thought the early stages of the crisis were rough sledding, but the Lehman Brothers implosion ushered in an even more torrid environment.
The fiscal bazooka. September 26, 2008.
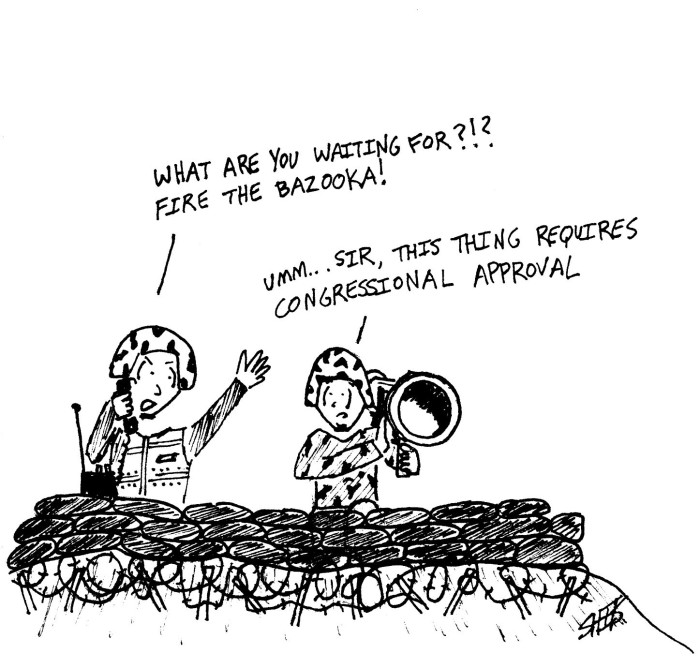
By late September, the Federal Reserve started opening up swap lines with foreign central banks, and Treasury began to draft legislation that would give it authority to buy stricken assets and prop up banks. But Congress rejected the first bill, causing carnage on markets.
Wall Street versus Main Street. December 3, 2008.
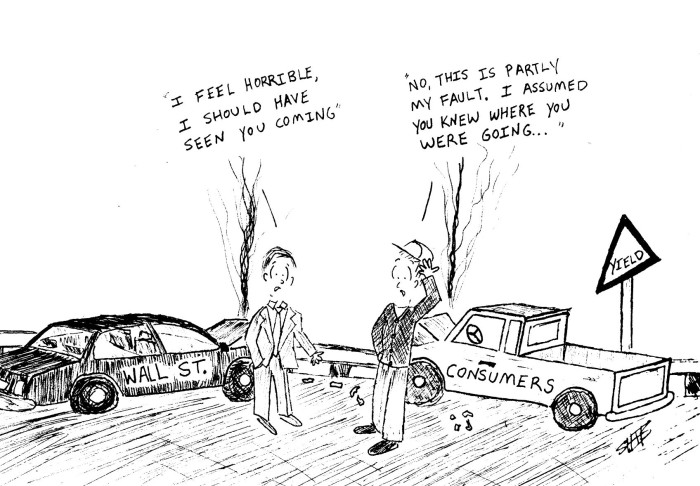
The Wall Street v Main Street car crash. “I assumed you knew where you were going.”
Liquidity injections. December 3, 2008.
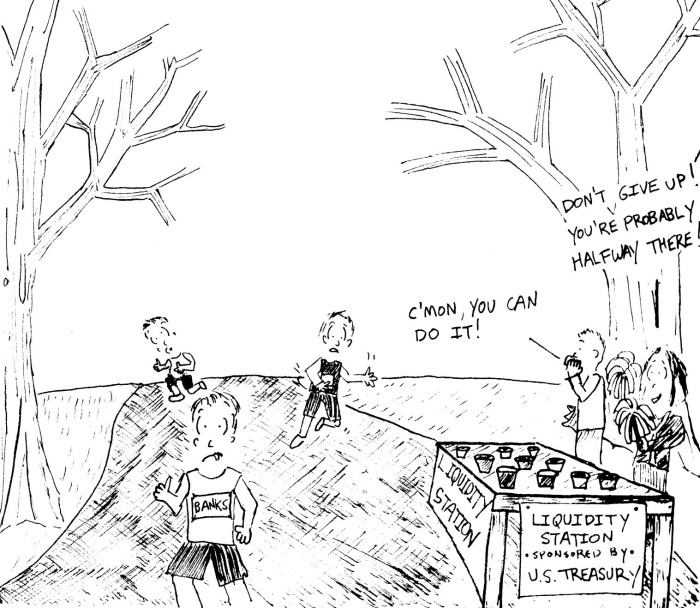
By the end of 2008, the US Treasury has unveiled fiscal stimulus and a series of bailouts for Wall Street institutions, while the Fed had slashed interest rates and started buying up bonds. But the situation still looked precarious, despite all the liquidity provision.
Bank twister. October 21, 2009.
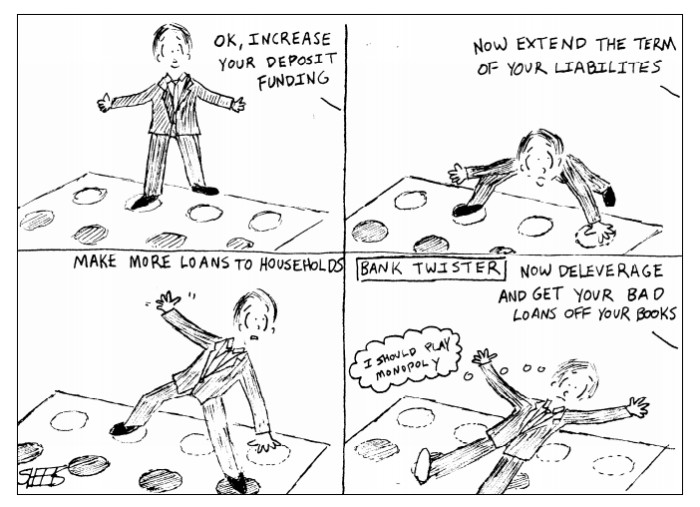
Markets and the economy began to recover in mid-2009, but there was understandable outrage at the role banks had played in the financial crisis – which led to a series of tricky demands on what they should do.
The European crisis. January 10, 2011.
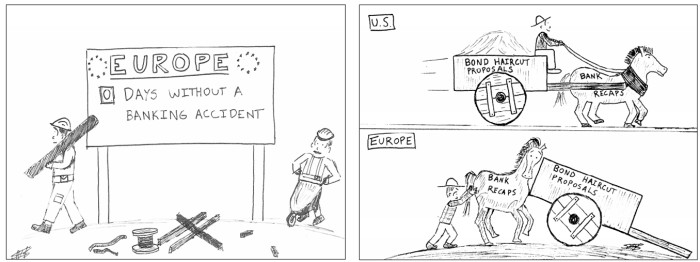
By 2010 the crisis was abating in the US but starting to worsen in Europe. That led to some very different approaches, such as Europe’s attempt to restructure debt before ensuring that the banking sector was resilient enough to handle the losses.
Teenage bond market. March 28, 2013.
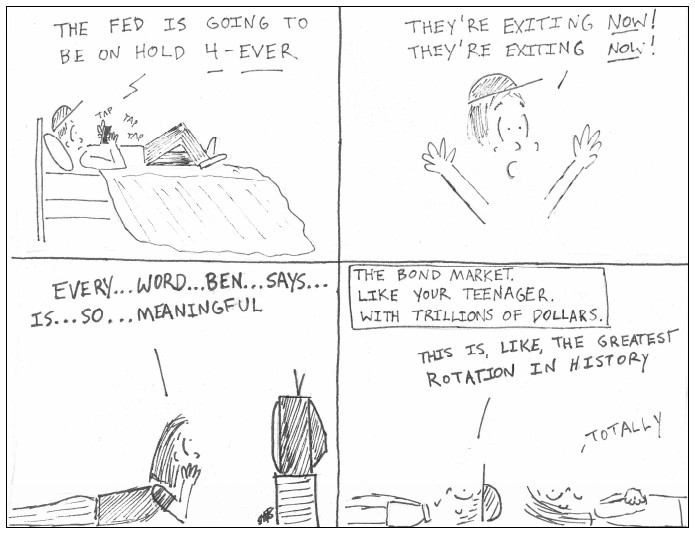
Here Mr Sheets pokes fun at the bond market’s adolescent tendencies.
“Whatever it takes.” June 3, 2013.
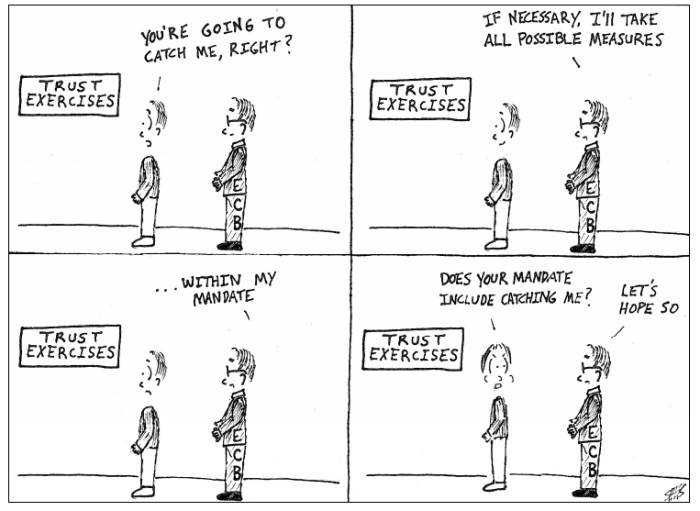
In 2012, ECB president Mario Draghi had promised to do “whatever it takes” to save the euro. But there were still gnawing concerns among that there wasn’t enough political will to back Mr Draghi, noting that his famous speech also included the caveat that the ECB would only do things that were “within our mandate”.
Go long. January 9, 2015.
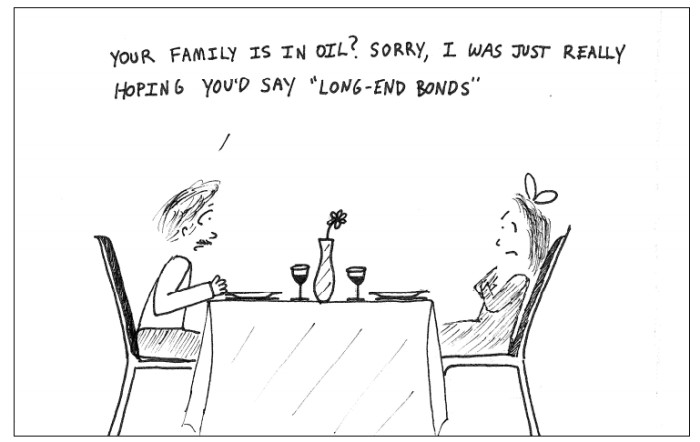
Markets continued to be unpredictable. Oil prices cratered in 2014-15, thanks to the US shale revolution and Opec’s attempts to crush it, while long-term Treasuries went on a wild rally that would push the 30-year US government bond yield to a record low of 3.2 per cent that January.
The great yield evaporation. July 14, 2016.
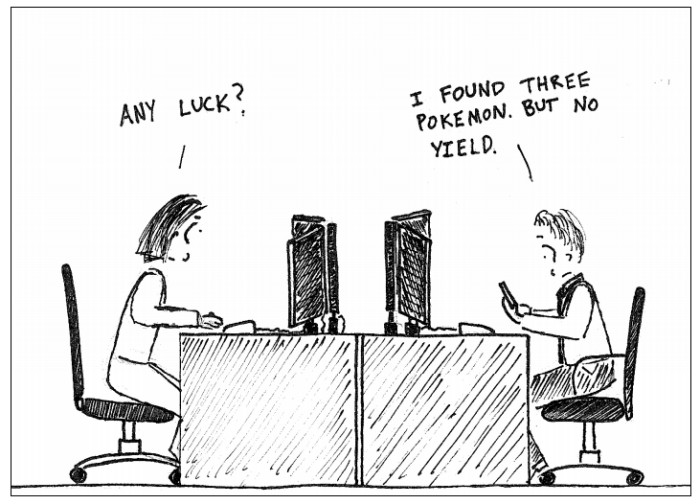
But the US bond market soon became one of the few places investors could at least find some yield, given the ECB and Bank of Japan’s massive stimulus programmes and negative interest rates.
The retail short. March 9, 2017.
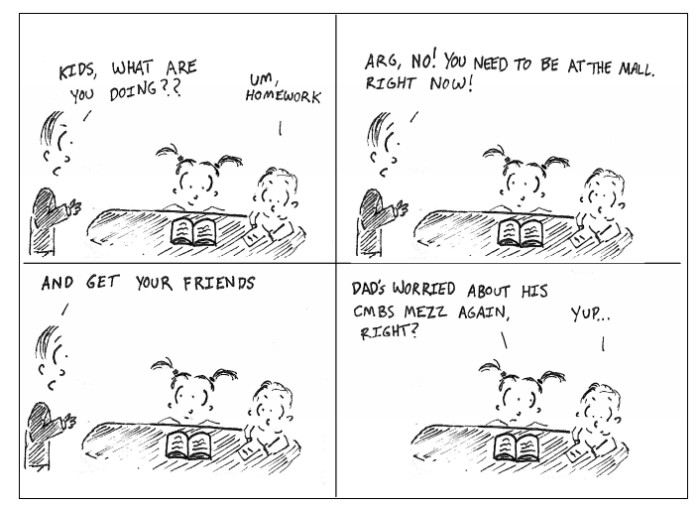
Last year, one of the hot trades was to bet against retail – whether the stock of the likes of Macy’s or commercial mortgage-backed securities with retail exposure - with online shopping cutting a swathe through the iconic US department store.
Tranquil markets. May 17, 2017.
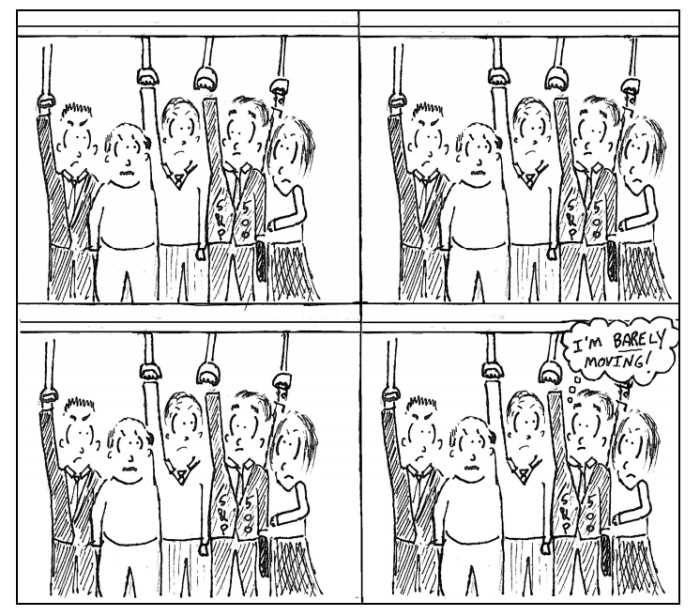
However, the dominant Wall Street theme last year was the utter absence of volatility, with the S&P 500 enjoying its calmest stretch of trading in history.
Going 'quantamental'. September 28, 2017.
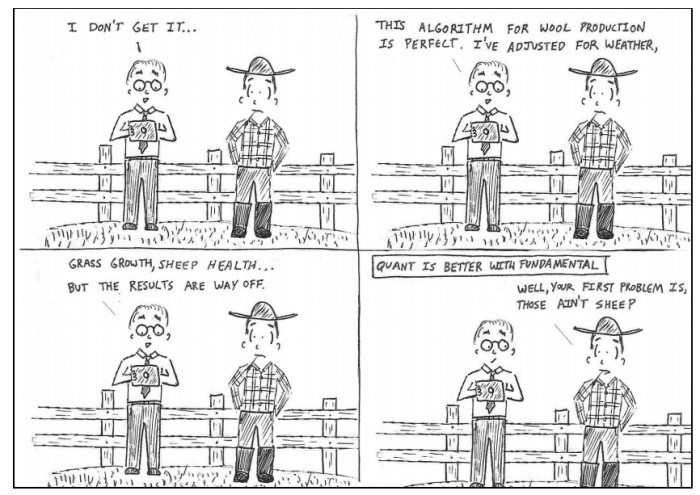
Another big trend on Wall Street is quantitative investing, using big data and fast machines to systematically comb through markets for trading signals. But as some analysts like Mr Sheets argue, it pays to combine quantitative techniques with a solid fundamental framework.

Comments