Market jitters spur September flight to Treasury ETFs
Simply sign up to the Exchange traded funds myFT Digest -- delivered directly to your inbox.
Latest news on ETFs
Visit our ETF Hub to find out more and to explore our in-depth data and comparison tools
Global investors pumped more than $35bn into exchange traded funds in September, but the bulk went to US Treasury funds as investors battened down the hatches and sought the safest of safe havens.
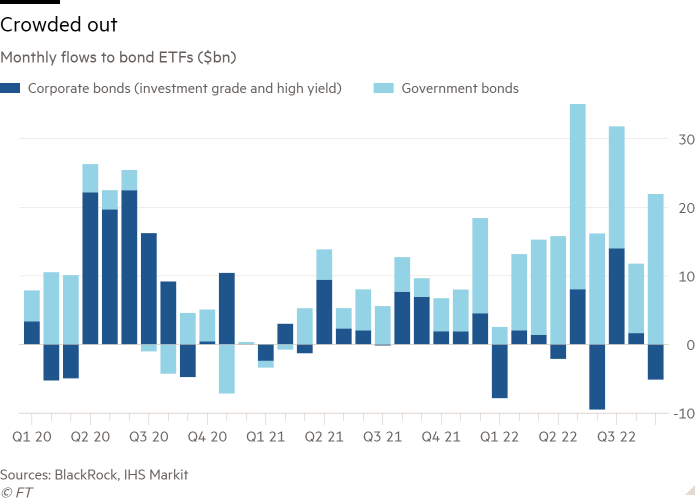
A total of $22.1bn — more than double the total for all government bonds in August — was squirrelled away into Treasuries in September, according to data from BlackRock. The lower total of $21.9bn in inflows for all government bonds indicate that Treasuries were the star of September’s show.
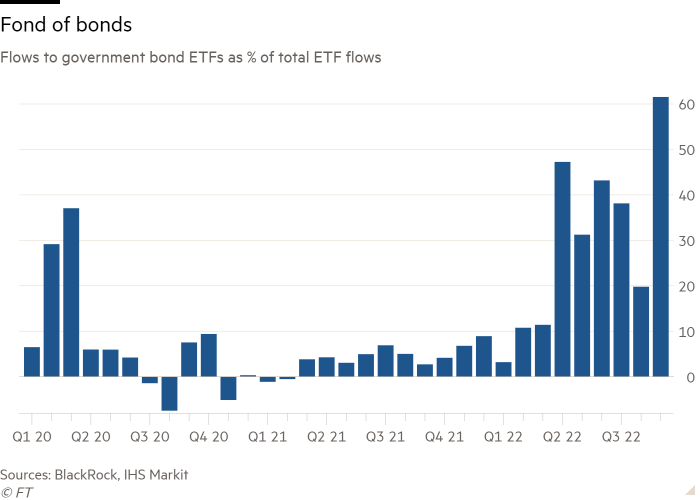
Government bonds including Treasuries accounted for 61 per cent of all inflows, up from just 19.8 per cent in August and the fourth-highest figure on record, BlackRock calculated.
In contrast, riskier bond exposures saw an exodus of money, with $2.7bn being sucked out of investment grade bond ETFs, $2.4bn out of high-yield bonds and $4.1bn from emerging market debt.
“We have seen a general waning of conviction around asset allocation decisions,” said Karim Chedid, head of investment strategy for BlackRock’s iShares ETF arm in the Emea region.
“We have seen a slowdown in fixed income flows, but that masks a big pick up in rates [government bond] flows, almost all short duration and an increase in the safe haven bid,” he added.
“Headline ETF flows remained resilient. A look under the surface tells otherwise,” said Scott Chronert, global head of ETF research at Citi, who analyses flows into US-listed funds.
“ETF users were clearly reluctant buyers of ‘risk’ as flows skewed to lower volatility exposures across asset classes.”
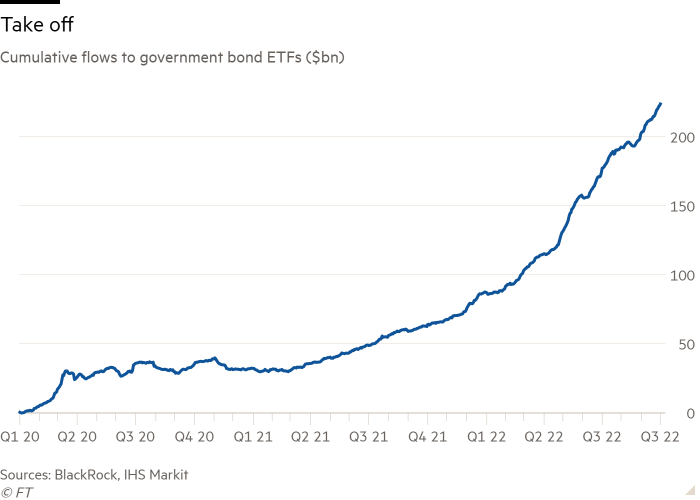
Government bond ETFs have now taken in a net $136bn this year, according to BlackRock’s data, while their corporate bond peers have gathered just $2.6bn. This is a marked turnround from as recently as 2020, when corporate bond ETFs attracted almost three-quarters of fixed income flows.
Chedid did not expect this year’s trend to reverse any time soon, with investors likely to focus on short-term Treasury exposures (up to three years’ duration) and even ultra-short (up to three months) as monetary tightening continues.
Strong demand for Treasury ETFs did at least prevent inflows to ETFs at large from falling below $35.9bn in September, although this was still comfortably down on August’s $51.2bn.
Equity flows held up reasonably well, dipping a fraction to $31bn, from $31.4bn in August, but the true picture remains unclear.
Emerging market equities accounted for an unusually large $7.7bn slice of this, the highest figure since April, almost entirely into ETFs listed in the Asia-Pacific region.
However, there have been reports that China is attempting to stabilise its stock market before the Communist party congress, due to start on October 16, potentially explaining much of the buying.
Even when it comes to US-listed equity ETFs, Chronert was unconvinced that this was a bullish sign, arguing that “strong US equity trading ETF inflows may be misread. A spike in shares outstanding could be a sign of continued short demand”.
This is because, as a result of the financial plumbing that underpins ETFs, shorting a fund leads to the creation of new ETF shares just as rising demand to go long on an ETF does.
“Short interest in [several US equity ETFs] has risen,” Chronert added. He also noted, in the past month, most of the flows have gone into the least volatile quartile of US equity ETFs, with outflows from the most volatile segments, again pointing to risk aversion.
“ETF investors were not high conviction buyers,” he said.
Chedid also reported a rotation into defensive sectors and factors, such as utilities, healthcare, quality stocks and minimum volatility funds, with the latter taking in $2.7bn in September. Financials, industrials, materials and technology ETFs saw outflows.
“Investors sought the relative safety of low-risk equities in hopes of participating in some of the upside but controlling the downside heading into the fourth quarter,” said Todd Rosenbluth, head of research at VettaFi.
In particular, Rosenbluth noted that the iShares MSCI USA Min Vol Factor ETF (USMV) had attracted $1.5bn in September, while the Utilities Select Sector SPDR Fund (XLU) pulled in $612mn.
Chedid attributed the lack of investor capitulation, despite this year’s sell-off, to “a reluctance to try and time the market and to crystallise losses”.
“If you sell you have to worry about timing your re-entry and you will probably miss it,” he added.
Moreover, Chedid noted continued demand for “sustainable” ETFs, especially in Europe, where they accounted for 50 per cent of equity fund flows in September.
Commodity ETFs endured their fifth straight month of outflows, the BlackRock data show. The $6.9bn of net selling in September took the total since May to $32.4bn, meaning year-to-date flows have now turned negative, despite strong demand for the likes of energy ETFs earlier in the year.
“We are seeing some outflows from commodities mostly because of waning sentiment around demand fears because of the recession that’s starting to play out in Europe and the UK and recession risk in the US,” Chedid said.
Gold funds accounted for the bulk of selling in September, $5.1bn worth. However Chedid was optimistic about the gold price, noting the possibility of rising physical demand from retail buyers in India and China ahead of seasonal celebrations.
“We haven’t had that for a few years because either China has been in lockdown or India has. That should provide a boost,” he argued.

Click here to visit the ETF Hub

Comments