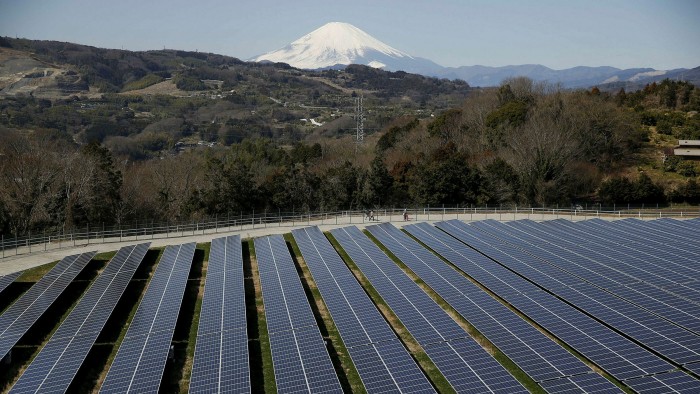
A field of solar panels in Japan
A field of solar panels in Japan — home to 86 companies on the Climate Leaders list © Issei Kato/Reuters

The companies on the inaugural FT-Nikkei-Statista Asia-Pacific Climate Leaders list are located in a region where the risks posed by climate change are especially acute.

It comprises the world’s largest and most populous continent, which includes China — the largest national emitter of greenhouse gases in 2021 — as well as the world’s largest ocean.

And the Asia-Pacific region has already been feeling the effects of global warming, from 2019-20’s bushfires to flash floods in central China last year and this year’s floods in Australia.

For some of its low-lying island nations, the threat is even starker — a point made by Tuvalu’s foreign minister when he recorded a speech knee-deep in seawater for the COP26 climate summit in Glasgow.

At the same time, Asia-Pacific’s need for development has caused its carbon emissions to soar. According to data-provider Statista, these reached nearly 17bn tonnes in 2020 — more than the rest of the world combined.

However, at COP26, its two most populous countries, China and India, intervened to weaken a pledge to eliminate coal, insisting on a commitment to “phase down” rather than “phase out” its use.

But, if governments appear to be dragging their feet on climate change, the Climate Leaders list — compiled in partnership with Nikkei Asia and Statista — shows that some businesses are in more of a hurry.

Like its European counterpart, it identifies the companies that achieved the greatest reduction in their Scope 1 and 2 greenhouse gas (GHG) emissions intensity between 2015 and 2020.

Scope 1 and 2 emissions — “core emissions” in the table — come respectively from a company’s own operations and from generating the energy it uses, while intensity is defined as tonnes of emissions of CO₂-equivalent per $1mn of revenue. The latter metric means that, even when a company’s absolute emissions rise as its revenue grows, there may not be a commensurate rise in the intensity data.

However, for businesses whose annual core emissions exceeded 2mn tonnes, a rating of at least A- from environmental performance monitor CDP was mandatory. The editors also reserved the right to exclude companies whose broader environmental record — on non-GHG pollution, for example, or deforestation — was sufficiently disputed to undermine any claim to be a “climate leader”.

Of the 200 companies listed, the biggest cut in emissions intensity was achieved by Bank Australia, a customer-owned financial services provider in Australia.

In terms of sectors, though, technology & electronics was the best represented in the list with 29 companies, while financial services was second, with 21.

Japan was home to the most companies listed, with 86, followed by Australia, with 47, and India, with 20.

These numbers come with some significant caveats, though.

First, concerns over data accessibility and reliability mean that some countries — notably China — are excluded from the list.

Second, the intensity calculation does not factor in Scope 3 emissions — that is, those occurring along the large stretches of the value chain not covered by Scopes 1 and 2. This is because, while they typically account for most of a business’s emissions, they are not always disclosed and, even when they are, metrics vary, making comparisons hard.

Finally, as noted above, because the intensity calculation is based on emissions relative to revenue, some rapidly growing companies on the list actually increased their absolute emissions over the five-year period.

This is not to belittle the achievements of the Climate Leaders: some action is clearly better than no action. However, as levels of atmospheric CO₂ continue to hit record levels, Asia-Pacific’s leaders — both business and political — will need to do much more if their fast-developing region is not to become a victim of its own carbon-intensive success.

A print and online report on the Asia-Pacific Climate Leaders 2022 will be published on June 13, containing articles analysing the issues that this research raises.

Scroll down to the bottom of the interactive table for the full research methodology.
Asia-Pacific Climate Leaders 2022
CompanyCountrySectorReduction of core emissions intensity (Scope 1 and 2)
 YoY 2015-20 [1]
Core emissions intensity
(GHGs in tonnes per $mn revenue) [2]
Core emissions in tonnes (CO₂ equivalent) [2]Total reduction of core emissions 2015-20 [3]Scope 3 emissions reported? [4]CDP Rating [5]Participation in Science Based Targets initiative (SBTi) [6]
Bank AustraliaAustraliaFinancial Services48.4%0.66694.8%yesBCommitted
AsusTaiwanTechnology & Electronics43.2%1.420,43094.8%yesB-
LenovoHong KongTechnology & Electronics36.7%0.528,78886.3%yesA-Targets Set, 1.5°C
Jubilant PharmovaIndiaPharmaceuticals35.9%124.5103,98088.6%noB--
Japan Metropolitan Fund [a]JapanProperty28.3%44.435,49275.1%yesA--
BTS GroupThailandTransport & Logistics28.2%49.870,390-29.2%yesB-
MMGAustraliaMetals & Mining27.4%48.5147,17368.6%noNot scored (F)-
Charter HallAustraliaProperty25.8%242.9103,5868.2%noNot scored (F)-
China Development FinancialTaiwanFinancial Services25.0%2.822,021-74.5%yesBCommitted
MindtreeIndiaTechnology & Electronics23.7%4.44,84656.2%yesA--
DuskinJapanPersonal & Household Goods23.5%21.431,79575.7%yesB-
HDFC BankIndiaFinancial Services22.4%25.6315,14034.1%yesB-
Harvey Norman AustraliaRetail & Ecommerce21.9%48.1114,96217.9%noNot scored (F)-
WiproIndiaConsulting & Professional Services20.3%11.497,34863.1%yesATargets Set, 1.5°C
KB Financial GroupSouth KoreaFinancial Services20.1%5.3139,888-1.6%yesATargets Set, 1.5°C
Tata Consultancy ServicesIndiaConsulting & Professional Services19.7%9.5210,27855.4%yesB-
Delta ElectronicsTaiwanTechnology & Electronics18.9%17.8177,81151.3%yesA-Targets Set, 2°C
Tata CommunicationsIndiaTelecommunications18.8%48.6114,85870.7%noB-
Kintetsu GroupJapanTransport & Logistics18.5%54.9369,92340.3%yesB-
GrainCorpAustraliaAgriculture18.4%31.9105,35362.1%noNot scored (F)-
Samsung EngineeringSouth KoreaConstruction & Building Materials18.4%9.458,66662.2%yes--
Worley AustraliaEnergy & Utilities18.0%13.5136,02644.7%yesBCommitted
Ambuja CementIndiaConstruction & Building Materials17.6%4,079.513,943,0323.7%yesA-Targets Set, Well-below 2°C
Keppel CorporationSingaporeConstruction & Building Materials17.6%44.8223,90175.7%yesB-
Vicinity CentresAustraliaProperty17.0%147.5138,15644.4%noA--
DentsuJapanMedia, Marketing & Education16.6%3.026,95553.8%yesA-Targets Set, 2°C
Grange ResourcesAustraliaMetals & Mining16.5%646.6262,118-3.8%no--
Takeda PharmaceuticalJapanPharmaceuticals15.9%9.8302,50025.8%yesA-Targets Set, 1.5°C
MaricoIndiaPersonal & Household Goods15.6%8.39,24542.8%noB-
Samsung Fire & Marine Insurance South KoreaInsurance15.4%0.715,15352.0%noB-
QBE Insurance GroupAustraliaInsurance14.8%1.419,31857.8%yesB-
Stockland AustraliaProperty14.7%34.775,06340.0%no-Committed
Tech Mahindra [b]IndiaTechnology & Electronics14.6%14.174,34935.0%yesATargets Set, 2°C
IndusInd BankIndiaFinancial Services14.4%23.664,988-18.3%yesB-
Pilipinas Shell Petroleum [c]PhilippinesEnergy & Utilities14.1%51.9169,56253.2%no--
HCL Technologies IndiaConsulting & Professional Services14.0%15.7151,8705.4%yesBCommitted
Acer GroupTaiwanTechnology & Electronics14.0%1.212,19950.5%noA--
Saracen Mineral [d]AustraliaMetals & Mining13.8%216.7179,248-104.8%noNot scored (F)-
Micro-Star InternationalTaiwanTechnology & Electronics13.5%11.861,34516.9%noNot scored (F)-
Hyundai Glovis  [e]South KoreaTransport & Logistics13.4%206.03,133,19945.3%noA-
HavellsIndiaPersonal & Household Goods13.1%49.470,4524.9%noNot scored (F)-
Marubeni [f]JapanRetail & Ecommerce13.0%0.02,15856.6%noA--
Nomura Research InstituteJapanConsulting & Professional Services13.0%10.455,39234.8%yesATargets Set, 1.5°C
Horizon PowerAustraliaEnergy & Utilities12.6%163.467,82444.0%no--
WestpacAustraliaFinancial Services12.2%8.4107,63438.8%yesBCommitted
Yahoo JapanJapanMedia, Marketing & Education12.1%10.1118,0573.2%yesNot scored (F)Committed
MaruiJapanRetail & Ecommerce12.1%23.048,94852.8%yesA-Targets Set, 1.5°C
Resolute MiningAustraliaMetals & Mining11.7%108.651,71027.6%noNot scored (F)-
Tokyo ElectronJapanTechnology & Electronics11.5%12.5169,000-14.2%yesBCommitted
InfosysIndiaConsulting & Professional Services11.5%9.9139,40714.9%yesATargets Set, Well-below 2°C
BNK Financial Group [g]South KoreaFinancial Services11.5%5.224,82646.8%yesNot scored (F)Committed
JSR CorporationJapanChemicals & Materials11.4%204.6882,48837.1%yesB--
OZ MineralsAustraliaMetals & Mining11.4%268.9277,88916.7%noNot scored (F)-
The WarehouseNew ZealandRetail & Ecommerce11.4%4.811,70733.0%yesB-
Resona HoldingsJapanFinancial Services11.2%9.256,81831.9%noB-
CTBC BankTaiwanFinancial Services11.2%20.941,90627.5%yesA--
JK Tyre & IndustriesIndiaAutomobiles & Components11.1%258.0217,94650.7%noB-Committed
KajimaJapanConstruction & Building Materials10.9%9.2170,32738.5%yesA--
E InkTaiwanTechnology & Electronics10.7%80.043,53634.3%no-Committed
Sumitomo Dainippon PharmaJapanPharmaceuticals10.6%10.954,08126.9%yesB-
Globe TelecomPhilippinesTelecommunications10.5%152.1463,511-83.1%noBCommitted
BramblesAustraliaTransport & Logistics10.4%16.560,25050.1%noBCommitted
Nissan Chemical JapanChemicals & Materials10.3%157.5318,00031.2%yesA--
Benesse HoldingsJapanMedia, Marketing & Education10.3%1.35,28044.1%yesA--
Mitsubishi Heavy IndustriesJapanMachines & Industrial Equipment10.2%11.9423,64046.5%noB-
Goodman GroupAustraliaProperty10.2%13.427,17334.7%noNot scored (F)Committed
LS Cable & SystemSouth KoreaMachines & Industrial Equipment10.1%27.4121,90619.3%yes--
Sonic HealthcareAustraliaHealthcare & Medical Technology10.1%12.364,9794.4%no--
Daiwa HouseJapanConstruction & Building Materials10.0%10.6423,32223.7%noATargets Set, Well-below 2°C
Astellas PharmaJapanPharmaceuticals9.9%10.2122,59645.8%yesBTargets Set, 2°C
Pact GroupAustraliaMachines & Industrial Equipment9.8%162.0225,78213.6%noNot scored (F)-
InventecTaiwanTechnology & Electronics9.8%7.4132,92023.2%noB-
Sawai GroupJapanPharmaceuticals9.8%27.950,4009.5%yesB-
Fukuoka Financial GroupJapanFinancial Services9.8%10.227,03930.7%noB-
DexusAustraliaProperty9.6%92.6135,7008.7%noA-Targets Set, 1.5°C
NTTJapanTelecommunications9.5%26.63,070,00037.2%yesA-Targets Set, 1.5°C
Tokio MarineJapanInsurance9.5%1.367,14027.7%yesA-Committed
JSW Steel [h]IndiaMetals & Mining9.4%3,407.837,523,070-16.9%noA--
Ramsay Health CareAustraliaHealthcare & Medical Technology9.4%18.5173,088-1.4%noNot scored (F)-
GPT GroupAustraliaProperty9.4%509.268,72752.1%yes--
Z EnergyNew ZealandEnergy & Utilities9.4%2.66,58914.8%yes--
Insurance Australia GroupAustraliaInsurance9.3%3.821,31356.3%yesB-
Austin HealthAustraliaHealthcare & Medical Technology9.2%72.061,03613.6%no--
Super Retail GroupAustraliaRetail & Ecommerce9.1%30.265,75921.6%noNot scored (F)-
Bank of China (Hongkong)Hong KongFinancial Services9.1%6.463,67611.2%yes--
HomeProThailandRetail & Ecommerce9.1%30.663,01532.0%yesB-
BrickworksAustraliaConstruction & Building Materials9.0%380.8279,63417.7%noNot scored (F)-
SysmexJapanHealthcare & Medical Technology9.0%6.619,51024.5%yesA-Committed
St Vincent’s Health AustraliaAustraliaHealthcare & Medical Technology8.9%52.0102,8467.0%no--
SUMCO JapanTechnology & Electronics8.7%28.1790,00021.9%yesB--
Fuji Oil HoldingsJapanFood, Beverages & Tobacco8.7%117.1412,29719.3%yesATargets Set, Well-below 2°C
National Australia BankAustraliaFinancial Services8.6%8.489,40236.8%noA--
Monash HealthAustraliaHealthcare & Medical Technology8.5%43.576,9492.6%no--
NabtescoJapanMachines & Industrial Equipment8.5%19.552,5644.1%yesATargets Set, 1.5°C
SG HoldingsJapanTransport & Logistics8.4%31.7401,76910.1%yesA-
Chugai PharmaceuticalJapanPharmaceuticals8.3%13.5102,706-2.4%yesATargets Set, 1.5°C
Shinhan Financial GroupSouth KoreaFinancial Services8.2%4.790,8789.2%yesA-Committed
Powertech TechnologyTaiwanTechnology & Electronics8.1%153.7414,692-17.2%yesB-
ShimadzuJapanHealthcare & Medical Technology8.1%9.235,08024.5%noBTargets Set, 2°C
Sagawa Express [i]JapanTransport & Logistics7.8%28.7363,1167.4%yes-Committed
ANZAustraliaFinancial Services7.8%12.4134,09336.0%yesA--
MS&AD Insurance Group JapanInsurance7.8%1.778,13334.9%yesACommitted
Evolution MiningAustraliaMetals & Mining7.7%371.8556,040-95.7%no--
Chicony Power TechnologyTaiwanTechnology & Electronics7.7%72.489,39912.1%yes-Committed
ShiseidoJapanPersonal & Household Goods7.7%8.474,61919.1%yesA-Targets Set, Well-below 2°C
Hong Kong Exchanges and Clearing Hong KongFinancial Services7.6%7.719,1183.5%yesB--
Godrej IndustriesIndiaChemicals & Materials7.3%53.573,26211.7%noBCommitted
FANCLJapanPersonal & Household Goods7.3%9.310,36813.6%yesB--
QICAustraliaFinancial Services7.2%295.3120,079-11.9%no--
Brother Industries JapanTechnology & Electronics7.2%19.2116,86341.7%yesBTargets Set, 2°C
Nippon PaintJapanChemicals & Materials7.1%5.642,374-0.8%yesB-
Mount Gibson Iron AustraliaMetals & Mining7.0%215.374,9834.0%no--
China Life Insurance TaiwanInsurance7.0%0.43,394-12.5%yesB-
LG Innotek [j]South KoreaTechnology & Electronics6.9%39.8350,070-8.6%yesB-
Nippon Building FundJapanProperty6.9%183.8142,58218.7%noB-
Santen PharmaceuticalJapanPharmaceuticals6.9%12.830,96010.6%yesBTargets Set, 1.5°C
ToshibaJapanTechnology & Electronics6.8%39.51,166,12062.1%yesA-Targets Set, Well-below 2°C
Showa DenkoJapanChemicals & Materials6.7%360.33,388,00011.4%yesA--
Daikin IndustriesJapanMachines & Industrial Equipment6.7%45.11,086,41713.8%yesA-
LG Household & HealthcareSouth KoreaPersonal & Household Goods6.5%6.345,317-5.1%yesB--
AeonJapanRetail & Ecommerce6.4%38.13,016,8444.3%yesATargets Set, 1.5°C
Dai-ichi LifeJapanInsurance6.4%1.7129,60023.2%yesB-
City DevelopmentsSingaporeProperty6.4%8.713,86054.2%yesATargets Set, 1.5°C
Tokyo Steel ManufacturingJapanConstruction & Building Materials6.3%640.5891,15322.6%yesA-
Yue Yuen IndustrialHong KongPersonal & Household Goods6.3%65.6554,00027.8%yes- *Targets Set **
Gladstone PortsAustraliaTransport & Logistics6.3%231.291,35318.1%no--
Nippon ShinyakuJapanPharmaceuticals6.3%8.910,497-4.4%yesB--
Seven & i HoldingsJapanRetail & Ecommerce6.2%47.53,047,05220.2%yesA-Committed
Australia Pacific AirportsAustraliaAerospace & Defence6.2%89.256,13123.5%noNot scored (F)-
TeijinJapanChemicals & Materials6.1%169.31,367,54622.7%yesBTargets Set, Well-below 2°C
AdekaJapanChemicals & Materials6.0%71.7226,500-7.6%noB--
IsuzuJapanAutomobiles & Components6.0%8.8161,59627.3%yesA--
OmronJapanTechnology & Electronics6.0%19.5123,39442.3%yesA--
H.U. GroupJapanHealthcare & Medical Technology5.9%18.339,494-20.0%yesA-Committed
Pola OrbisJapanPersonal & Household Goods5.9%5.69,60039.4%yesA-
Nankai Electric RailwayJapanTransport & Logistics5.8%110.0202,63135.4%noB-
Hong Leong Asia  [k]SingaporeMachines & Industrial Equipment5.7%415.31,867,45917.8%no--
Australia PostAustraliaTransport & Logistics5.7%45.2261,22212.2%yesBTargets Set, Well-below 2°C
Regional Express AustraliaAerospace & Defence5.7%387.896,1126.2%no--
NTT DataJapanConsulting & Professional Services5.6%11.6260,032-7.9%yesA-Targets Set, 1.5°C
TransurbanAustraliaTransport & Logistics5.6%50.2139,817-45.5%yesBTargets Set, 1.5°C
AnritsuJapanTelecommunications5.6%12.312,55616.9%yesBTargets Set, 2°C
KokuyoJapanPersonal & Household Goods5.5%11.332,75525.4%yesB--
Bunka Shutter [l]JapanConstruction & Building Materials5.5%13.823,1468.9%no-Committed
Kubota [m]JapanMachines & Industrial Equipment5.4%31.9570,00015.3%yesA--
SapporoJapanFood, Beverages & Tobacco5.4%38.8162,74438.3%yesB-
KasikornbankThailandFinancial Services5.4%26.997,7862.6%noA--
St. John of God Health Care AustraliaHealthcare & Medical Technology5.4%52.574,751-7.6%no--
RengoJapanMachines & Industrial Equipment5.3%119.9788,0002.7%yesB-
CalbeeJapanFood, Beverages & Tobacco5.3%72.1185,79617.6%noB-
Nippon ExpressJapanTransport & Logistics5.2%40.0803,62516.4%yesB-
Obayashi JapanConstruction & Building Materials5.2%10.0170,46023.9%yesACommitted
Yes BankIndiaFinancial Services5.2%39.840,524-24.3%yesB-Committed
JVCKenwoodJapanTechnology & Electronics5.2%14.538,31528.4%yesB-
Yaskawa Electric JapanMachines & Industrial Equipment5.2%5.621,07627.4%yesB-
PT Aneka Tambang TbkIndonesiaMetals & Mining5.1%681.01,320,021-99.6%no--
Mitsui FudosanJapanProperty5.1%24.7478,6401.6%yesATargets Set, Well-below 2°C
Daiichi SankyoJapanPharmaceuticals5.1%19.7182,86524.9%noATargets Set, Well-below 2°C
Commonwealth BankAustraliaFinancial Services5.0%8.0114,3688.7%yesB-
Ridley AustraliaAgriculture4.9%148.4110,63117.3%no--
DiscoJapanTechnology & Electronics4.9%25.845,633-11.3%yesB--
Siam Commercial BankThailandFinancial Services4.9%7.122,8479.1%noB-
Nippon Yusen KKJapanTransport & Logistics4.8%753.311,699,49944.7%yesATargets Set, 2°C
Sony Semiconductor SolutionsJapanTechnology & Electronics4.8%16.01,393,00013.3%yes--
Power and Water CorpAustraliaEnergy & Utilities4.8%322.7201,53112.6%no--
ScreenJapanTechnology & Electronics4.8%16.450,6703.5%yesBTargets Set, Well-below 2°C
Sun Hung Kai PropertiesHong KongProperty4.7%29.0309,4082.9%yes--
ACC [n]IndiaConstruction & Building Materials4.6%7,557.914,262,5588.4%yesATargets Set, Well-below 2°C
Sumitomo Metal MiningJapanMetals & Mining4.6%308.52,759,00014.5%yesA--
Zhen Ding TechnologyTaiwanTechnology & Electronics4.6%191.8891,768-21.3%yesB--
Compal ElectronicsTaiwanTechnology & Electronics4.6%5.8214,6182.4%noB--
Delta Thailand [o]ThailandTechnology & Electronics4.6%20.443,510-7.8%yesNot scored (F)Targets Set, 2°C
IbidenJapanTechnology & Electronics4.5%187.6586,00018.3%noB-
Sumitomo Mitsui Financial GroupJapanFinancial Services4.5%10.8139,54625.3%yesB-
Sanwa HoldingsJapanConstruction & Building Materials4.5%6.627,0097.1%noB-
Taiyo YudenJapanTechnology & Electronics4.4%166.6484,0000.0%yesB-
South East WaterAustraliaEnergy & Utilities4.4%43.034,99018.9%no-Committed
Asahi KaseiJapanChemicals & Materials4.3%192.13,906,30113.1%yesA--
ITCIndiaPersonal & Household Goods4.3%189.11,340,000-7.5%yesA--
Maruti Suzuki India [p]IndiaAutomobiles & Components4.3%39.0391,0960.6%noNot scored (F)-
Sumitomo BakeliteJapanChemicals & Materials4.2%100.4202,60718.6%yesA--
FlexSingaporeConsulting & Professional Services3.3%30.7715,64419.8%yesA-Targets Set, 1.5°C
FujikuraJapanPersonal & Household Goods4.1%19.8123,04322.9%noA-Committed
NH FoodsJapanFood, Beverages & Tobacco3.9%42.0477,00021.7%yesB--
Lite-OnTaiwanTechnology & Electronics3.9%39.7225,73940.9%yesBTargets Set, 2°C
Western Power AustraliaEnergy & Utilities3.8%517.9732,27614.4%no--
KDDIJapanTelecommunications3.7%20.61,056,1261.2%yesA--
Companhia De Electricidade De MacauMacauEnergy & Utilities3.7%412.1342,76912.2%yes--
Lotte Fine Chemical [q]South KoreaChemicals & Materials3.6%539.8627,9969.6%noNot scored (F)-
MazdaJapanAutomobiles & Components3.6%19.6546,05029.6%yesA--
RicohJapanTechnology & Electronics3.6%17.3280,40036.5%yesATargets Set, 1.5°C
CSRAustraliaConstruction & Building Materials3.5%274.7468,11919.6%noNot scored (F)-
KMD BrandsNew ZealandRetail & Ecommerce3.5%20.811,990-64.2%noB-
SimsAustraliaMetals & Mining3.3%39.3148,60034.3%noB-
MeijiJapanPharmaceuticals3.2%52.3563,00019.2%yesA-Targets Set, Well-below 2°C
Thai UnionThailandFood, Beverages & Tobacco3.2%111.2490,76210.1%noNot scored (F)-
Hitachi Transport SystemJapanTransport & Logistics3.2%17.9112,99518.5%yesA--
AcBel Polytech TaiwanTechnology & Electronics3.1%52.338,87714.7%yes-Committed
Sandfire ResourcesAustraliaMetals & Mining3.0%155.797,506-27.0%noNot scored (F)-
AzbilJapanTechnology & Electronics3.0%7.117,00017.7%noATargets Set, 1.5°C

Footnotes

[1] Compound annual reduction rate (CARR) based on the sum of Scope 1 and 2 emissions and adjusted by revenue growth between 2015-2020

[2] Calculated for 2020

[3] Absolute change in GHG emissions between 2015 and 2020. Positive values reflect a reduction in emissions, negative values an increase. All the companies on the list have, however, cut their emissions intensity

[4] Scope 3 refers to indirect emissions, which can be reported for some or all of 15 categories and thus vary enormously. This is why absolute figures are left out here

[5] CDP is a non-profit organisation that assesses how well companies and other bodies report on and reduce their environmental impact

[6] SBTi is a partnership between CDP, the UN Global Compact, the World Resources Institute and WWF and helps companies set targets for reducing greenhouse gas emissions


[a] Part of MC-UBS Group

[b] Part of Mahindra Group

[c] Part of Royal Dutch Shell

[d] Merged with Northern Star Resources in 2021; data in this ranking refers solely to Saracen Mineral

[e] Part of Hyundai Group

[f] Data covers Marubeni Corporation’s principal offices

[g] Data covers main business sites

[h] Part of JSW Group

[i] Under SG Holdings

[j] Part of LG Group

[k] Part of Hong Leong Investment Holdings Pte. Ltd

[l] Emissions data for 2015 include partial Scope 3, which cannot be excluded

[m] Revenue for 2015 estimated

[n] Part of Holcim

[o] Part of Delta Electronics

[p] Part of Suzuki

[q] Data covers main business sites


* CDP score of parent company Pou Chen Corp: C

** Targets verified by the World Resources Institute


Methodology

Asia-Pacific Climate Leaders 2022 is a list of 200 Asia-Pacific companies that have achieved the greatest reduction in their greenhouse gas (GHG) emissions intensity.

Specifically, it aims to highlight the businesses whose GHG emissions intensity fell the most between 2015 and 2020. Emissions intensity is defined as tonnes of Scope 1 and Scope 2 emissions of CO2-equivalent per $1mn in revenue. The 2015 and 2020 figures are used to calculate the compound annual rate of reduction, expressed as a percentage.

All Asia-Pacific companies — defined as having headquarters in one of 14 Asia-Pacific countries — with a minimum revenue of $50mn in 2020 were eligible for consideration.

A call for entries in November 2021 invited prospective participants to fill out a short questionnaire about their GHG emissions between 2015 and 2020, and their revenue over the same period (or, for banks and insurance companies, total income). Statista also conducted independent research, scrutinising data from about 4,000 companies and inviting possible candidates to register.

Although the call for entries stipulated that businesses had to be independent, this rule was relaxed to allow subsidiaries that report their emissions independently to be listed.

For businesses with a rating from the Carbon Disclosure Project (CDP), only those with a score of at least B- were considered. Companies that do not work with CDP were still eligible, but for any company annually emitting more than 2mn tonnes of CO2-equivalent, a CDP rating of at least A- was mandatory.

The editors also reserved the right to exclude companies whose broader environmental records, beyond reported Scope 1 and 2 emissions, were sufficiently disputed to undermine any claim to be a “climate leader”.

All companies for which relevant data were found — both those that registered and those independently identified — were contacted so that they could review the data. Of those, the 200 with the greatest reduction in emissions intensity have made it into the final list of Asia-Pacific Climate Leaders 2022.

Fuller information about the methodology is available from Statista. Although extensive research was carried out, the list does not claim to be complete, as some companies did not publish their figures or did not participate.

Copyright The Financial Times Limited 2024. All rights reserved.
Reuse this content (opens in new window) CommentsJump to comments section

Follow the topics in this article

Comments